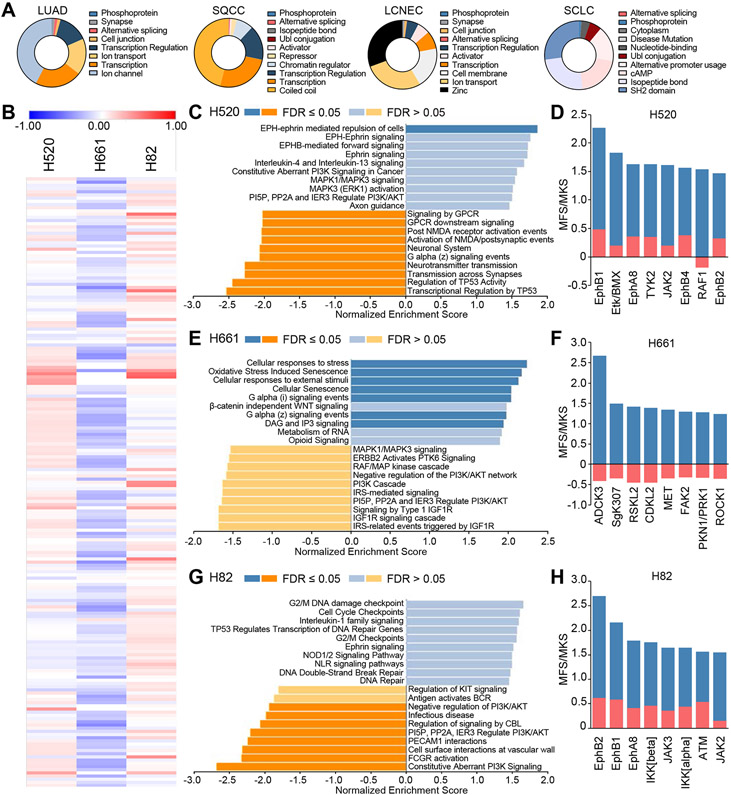
Figure 5. miR-31 differentially alters cellular signaling across histological subtypes of lung cancer.
(A) Functional annotation of RNA-seq data for the most downregulated miR-31 predicted targets (B) Heatmap of Mean Kinase Statistic (MKS; log fold change in miR-31 overexpression from parent) values by cell line (H520 SQCC, H661 LCLC, H82 SCLC). (C, E, G) GSEA using MKS values. (D, F, H) Top altered kinases identified using whole-chip (all peptides) comparison for alteration between miR-31 overexpression and control. Blue: mean final score (MFS) Red: MKS

