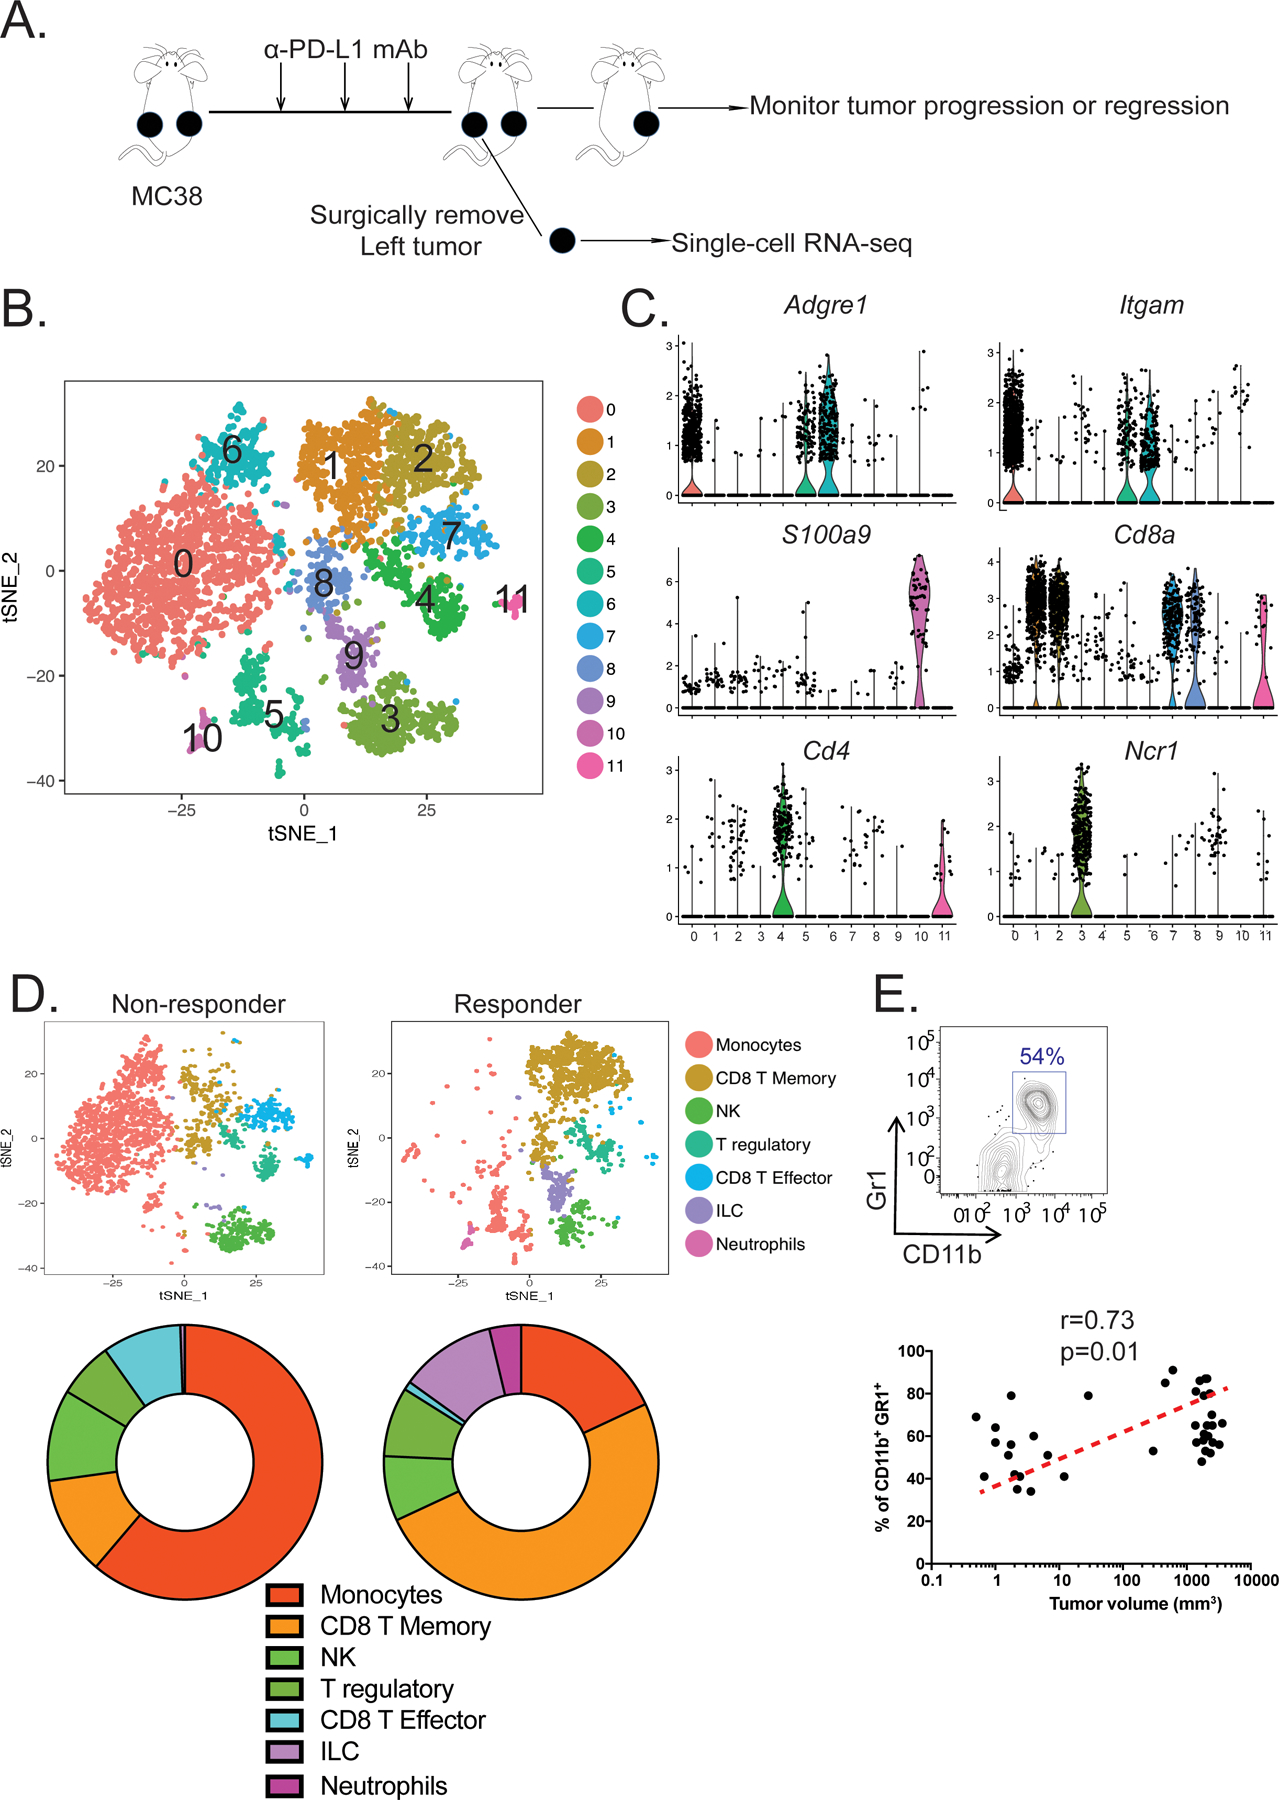
Figure 1. Single-cell transcriptomics reveal the distinct immune cell landscapes from an ICB responder and non-responder.

(A) Experimental design for establishing a bilateral tumor model to study the immune cell landscape associated with resistance to ICB immunotherapy in the MC38 colorectal cancer model. (B) t-distributed scholastic neighbor embedding (t-SNE) plot showing 12 immune cell clusters pooled from a responder and a non-responder. (C) Violin plots showing the gene expression distribution of various cell markers in all immune cell clusters. (D) t-SNE plots (top) demonstrating the different tumor-infiltrating immune cells between the non-responder (left) and responder (right). Proportions of immune cell-subsets found in the tumors are shown using pie charts (bottom). (E) The frequencies of intratumoral CD11b+Gr1+ MDSCs detected by flow cytometry (top) were plotted against the tumor volumes (bottom) for correlation (n=38, spearman’s correlation test, p < 0.05, r = 0.34).
