
Figure 3. Bevacizumab reduced lesion response heterogeneity and exhibited favorable efficacy on hepatic metastases.
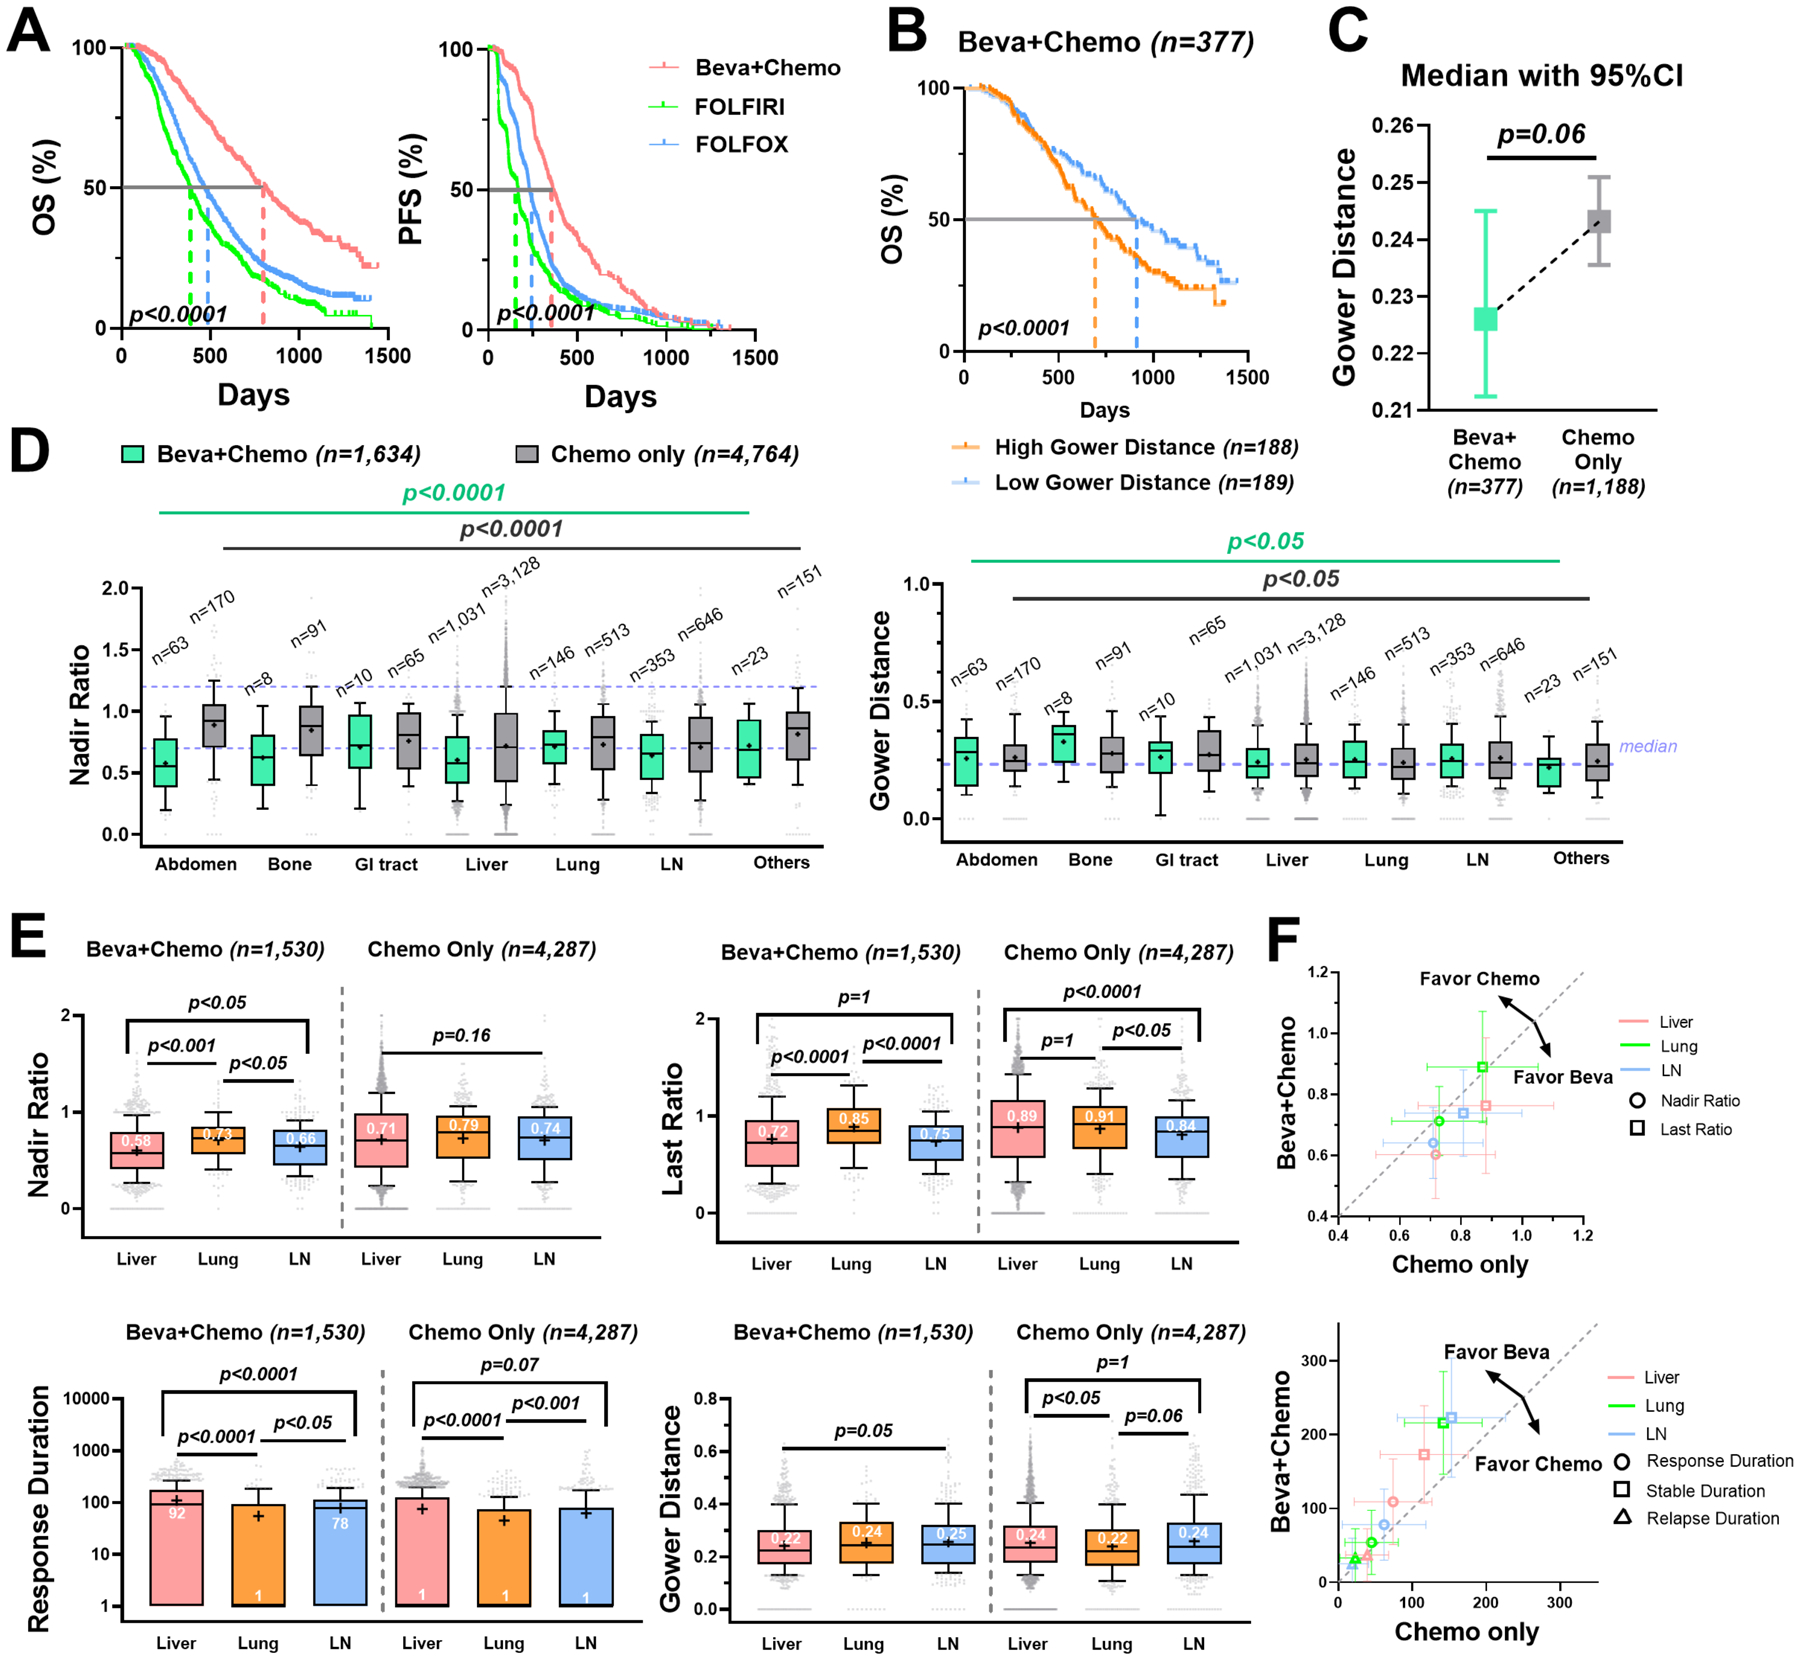
Beva+Chemo: bevacizumab plus chemotherapy; Chemo: chemotherapy alone. (A) Kaplan-Meier curves of the OS (left) and PFS (right) in Beva + Chemo (n = 377), FOLFOLX (n = 769 in OS and n = 741 in PFS) and FOLFIRI (n = 419) group. (B) Kaplan-Meier curves of the OS grouped by Gower distance (median as the cut-off) in the Beva + Chemo group. (C) Median with 95% confidence interval of the patient-level Gower distances in Beva + Chemo versus Chemo (FOLFOX and FOLFIRI) group. (D) Boxplots of the lesions’ nadir ratios with the 0.7 and 1.2 values labeled in purple dashed line (left) and the lesions’ Gower distances with median labeled in purple dashed line (right) across anatomical sites. (E) Boxplots of the nadir ratio, last ratio, response duration, and Gower distance in liver (n = 1,031), lung (n = 146) and LN metastases (n = 353) in the Beva + Chemo (left) compared to the Chemo only (right, liver n = 3,128; lung n = 513; LN n = 646). The durations were all added with one to avoid zero values in logarithmic plots. (F) The mean ± 50% standard deviation of nadir ratio and last ratio (upper) and response, stable, and relapse durations (lower) in the Beva + Chemo versus the Chemo only group. The dashed gray line is y = x.