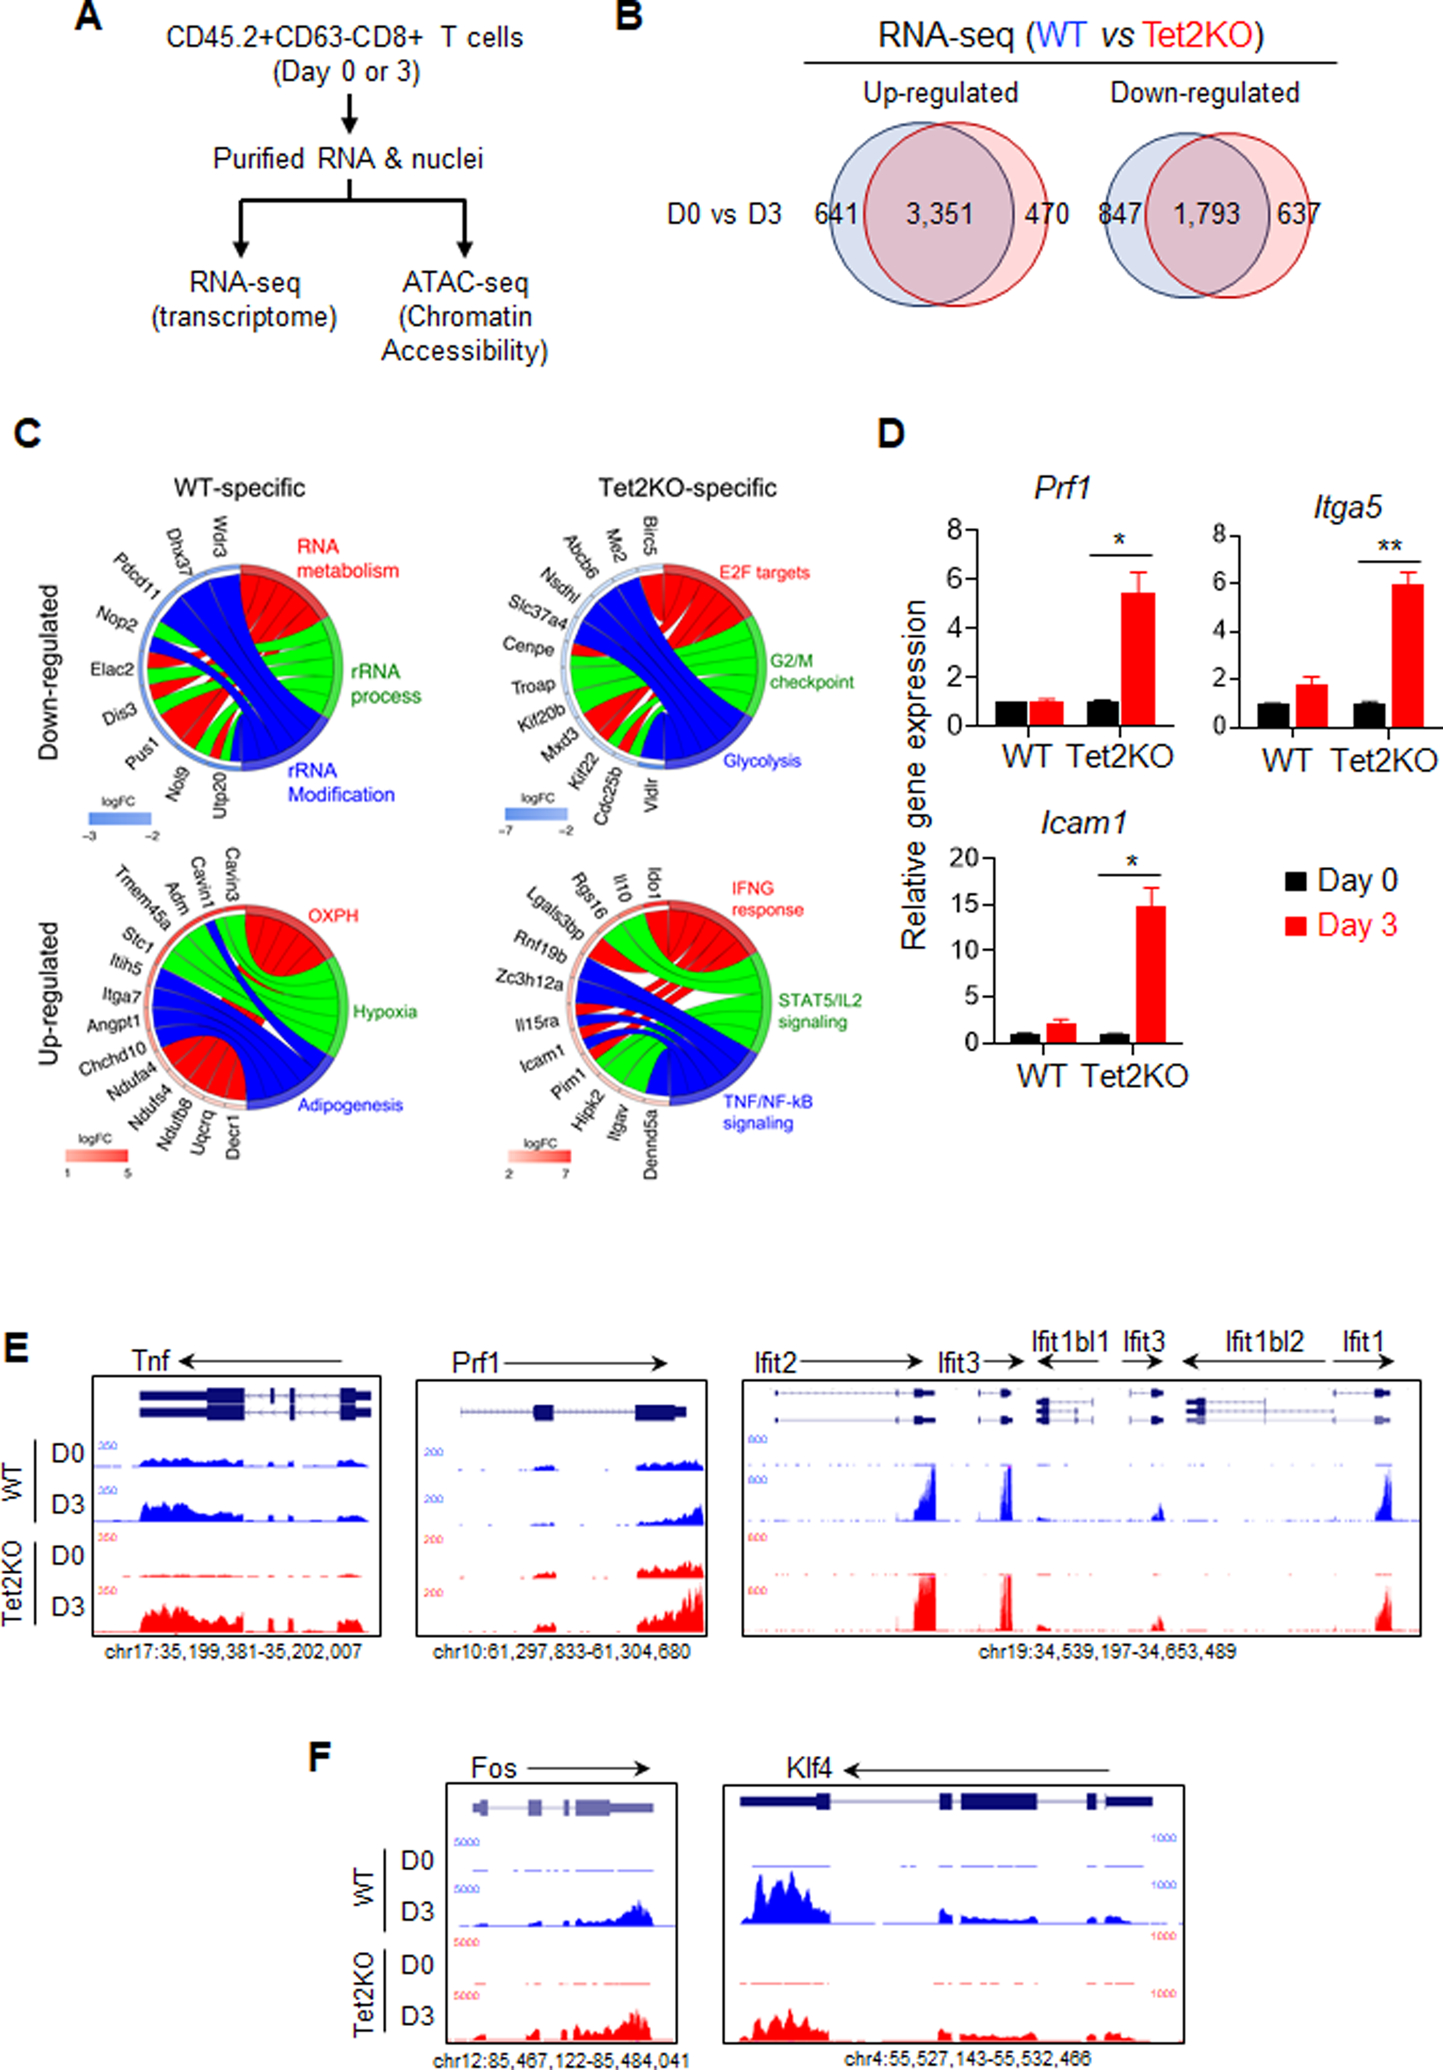
Figure 4. Tet2 deletion enhances the transcription of tumor-suppressive genes in TILs.

A. The experimental design for comparative RNA-seq and ATAC-seq analyses.
B. Venn diagrams showing WT- and Tet2-specific differentially expressed genes (DEGs) identified between Day 0 and Day 3 adoptively transferred TILs (WT vs Tet2KO).
C. GOplot illustrating the top 5 genes in the top three categories from the GSEA analysis of WT- and Tet2-specific DEGs. The left side of the circle displays the DEGs and color represents the log2 fold change (logFC). Red, upregulated genes; Blue, downregulated genes. The right side of the circle shows the GSEA categories.
D. Real-time quantitative PCR validation of selected DEGs annotated as regulators of immune response.
E-F. The UCSC genome browser view of RNA-seq data for representative genes that are involved in CD8+ T cell immunity and are up-regulated in the Tet2KO group.
