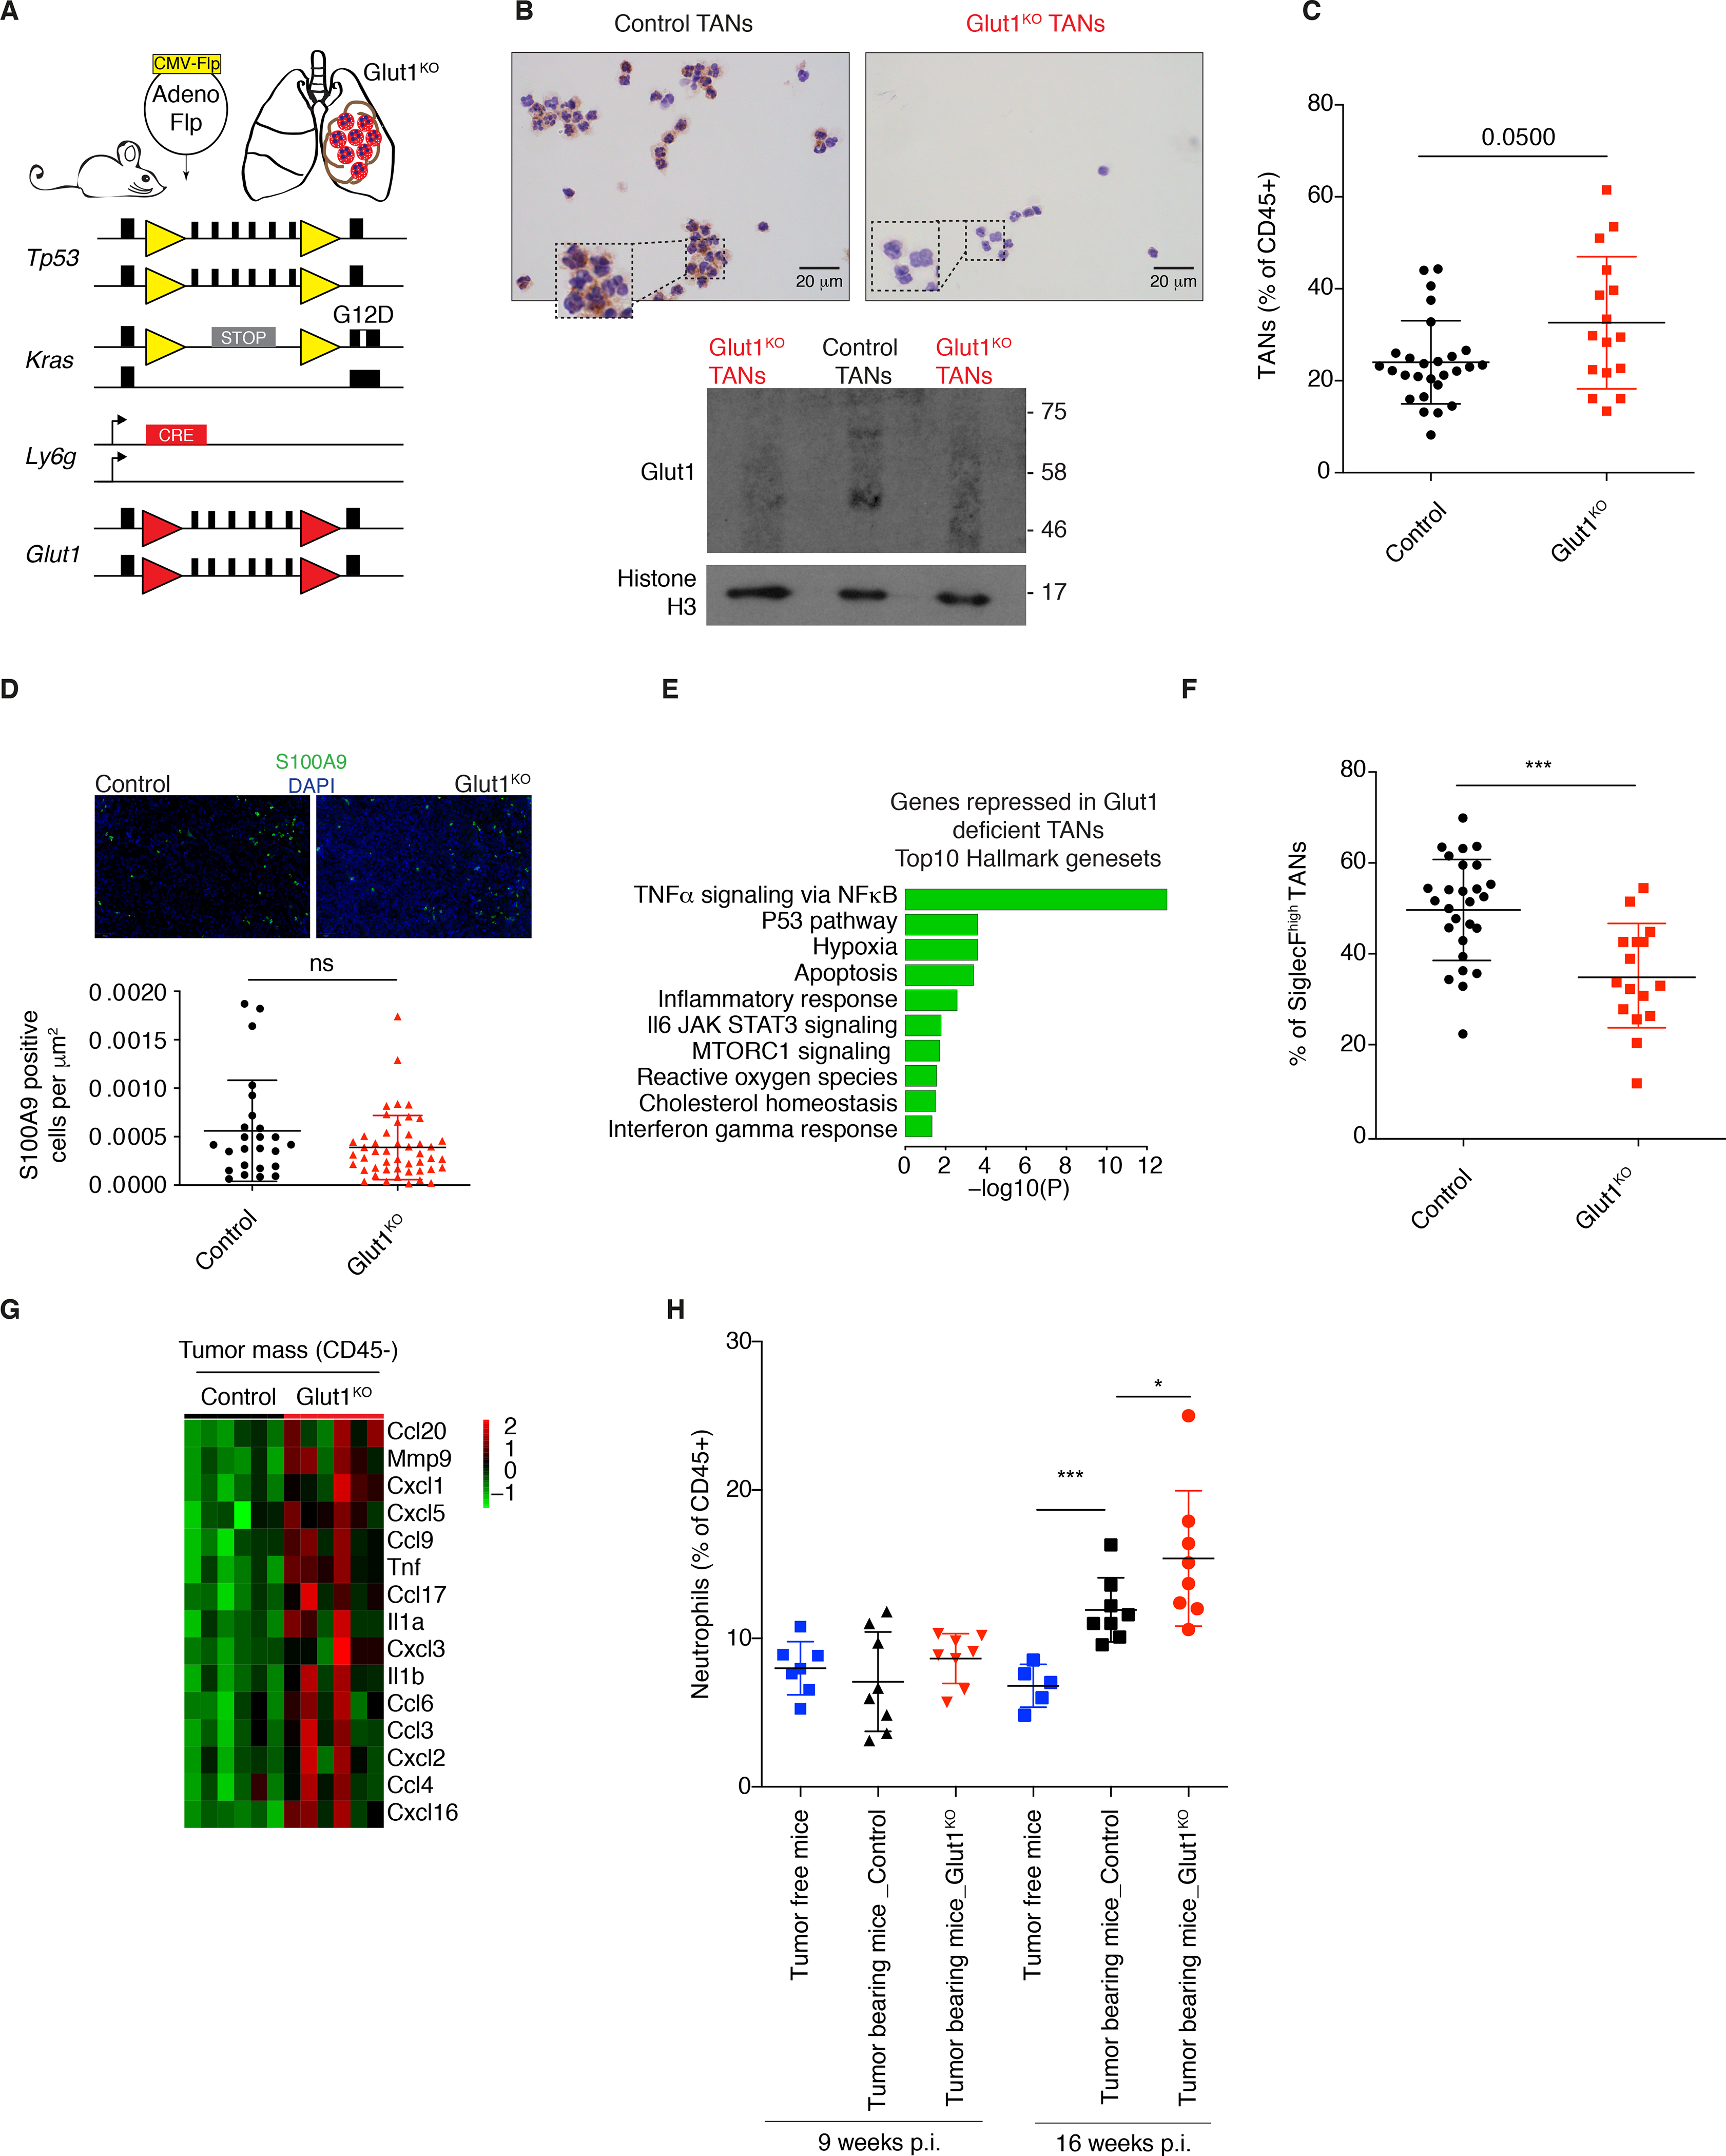
Figure 3. Neutrophil-specific Glut1 deletion reduces the proportion of SiglecFhigh TANs.

A) Schematic representation of the mouse model used. Yellow triangles, Frt sites; Red triangles, LoxP sites. B) Glut1 protein expression levels in isolated Glut1KO TANs or control TANs by immunocytochemistry. C) Neutrophil prevalence (mean ± s.d.) in KP tumors in control and Glut1KO conditions. D) Representative staining and quantification of S100A9 immunofluorescence from n= 25 control and n= 47 Glut1KO tumors. E) Top 10 pathways from Hallmark over-represented among the top 200 genes most repressed in Glut1KO TANs compared to WT TANs. P-value was computed with Fisher exact test. F) SiglecFhigh cells among control and Glut1KO TANs (mean ± s.d.). G) Heatmap of chemoattractant genes overexpressed in CD45- cells in Glut1KO compared to control neutrophil conditions. H) Neutrophil proportions in the blood of healthy and tumor-bearing mice 9 or 16 weeks post-tumor initiation (p.i.) (mean ± s.d.).
