
Figure 5. Glut1 deletion in neutrophils reduces tumor growth.
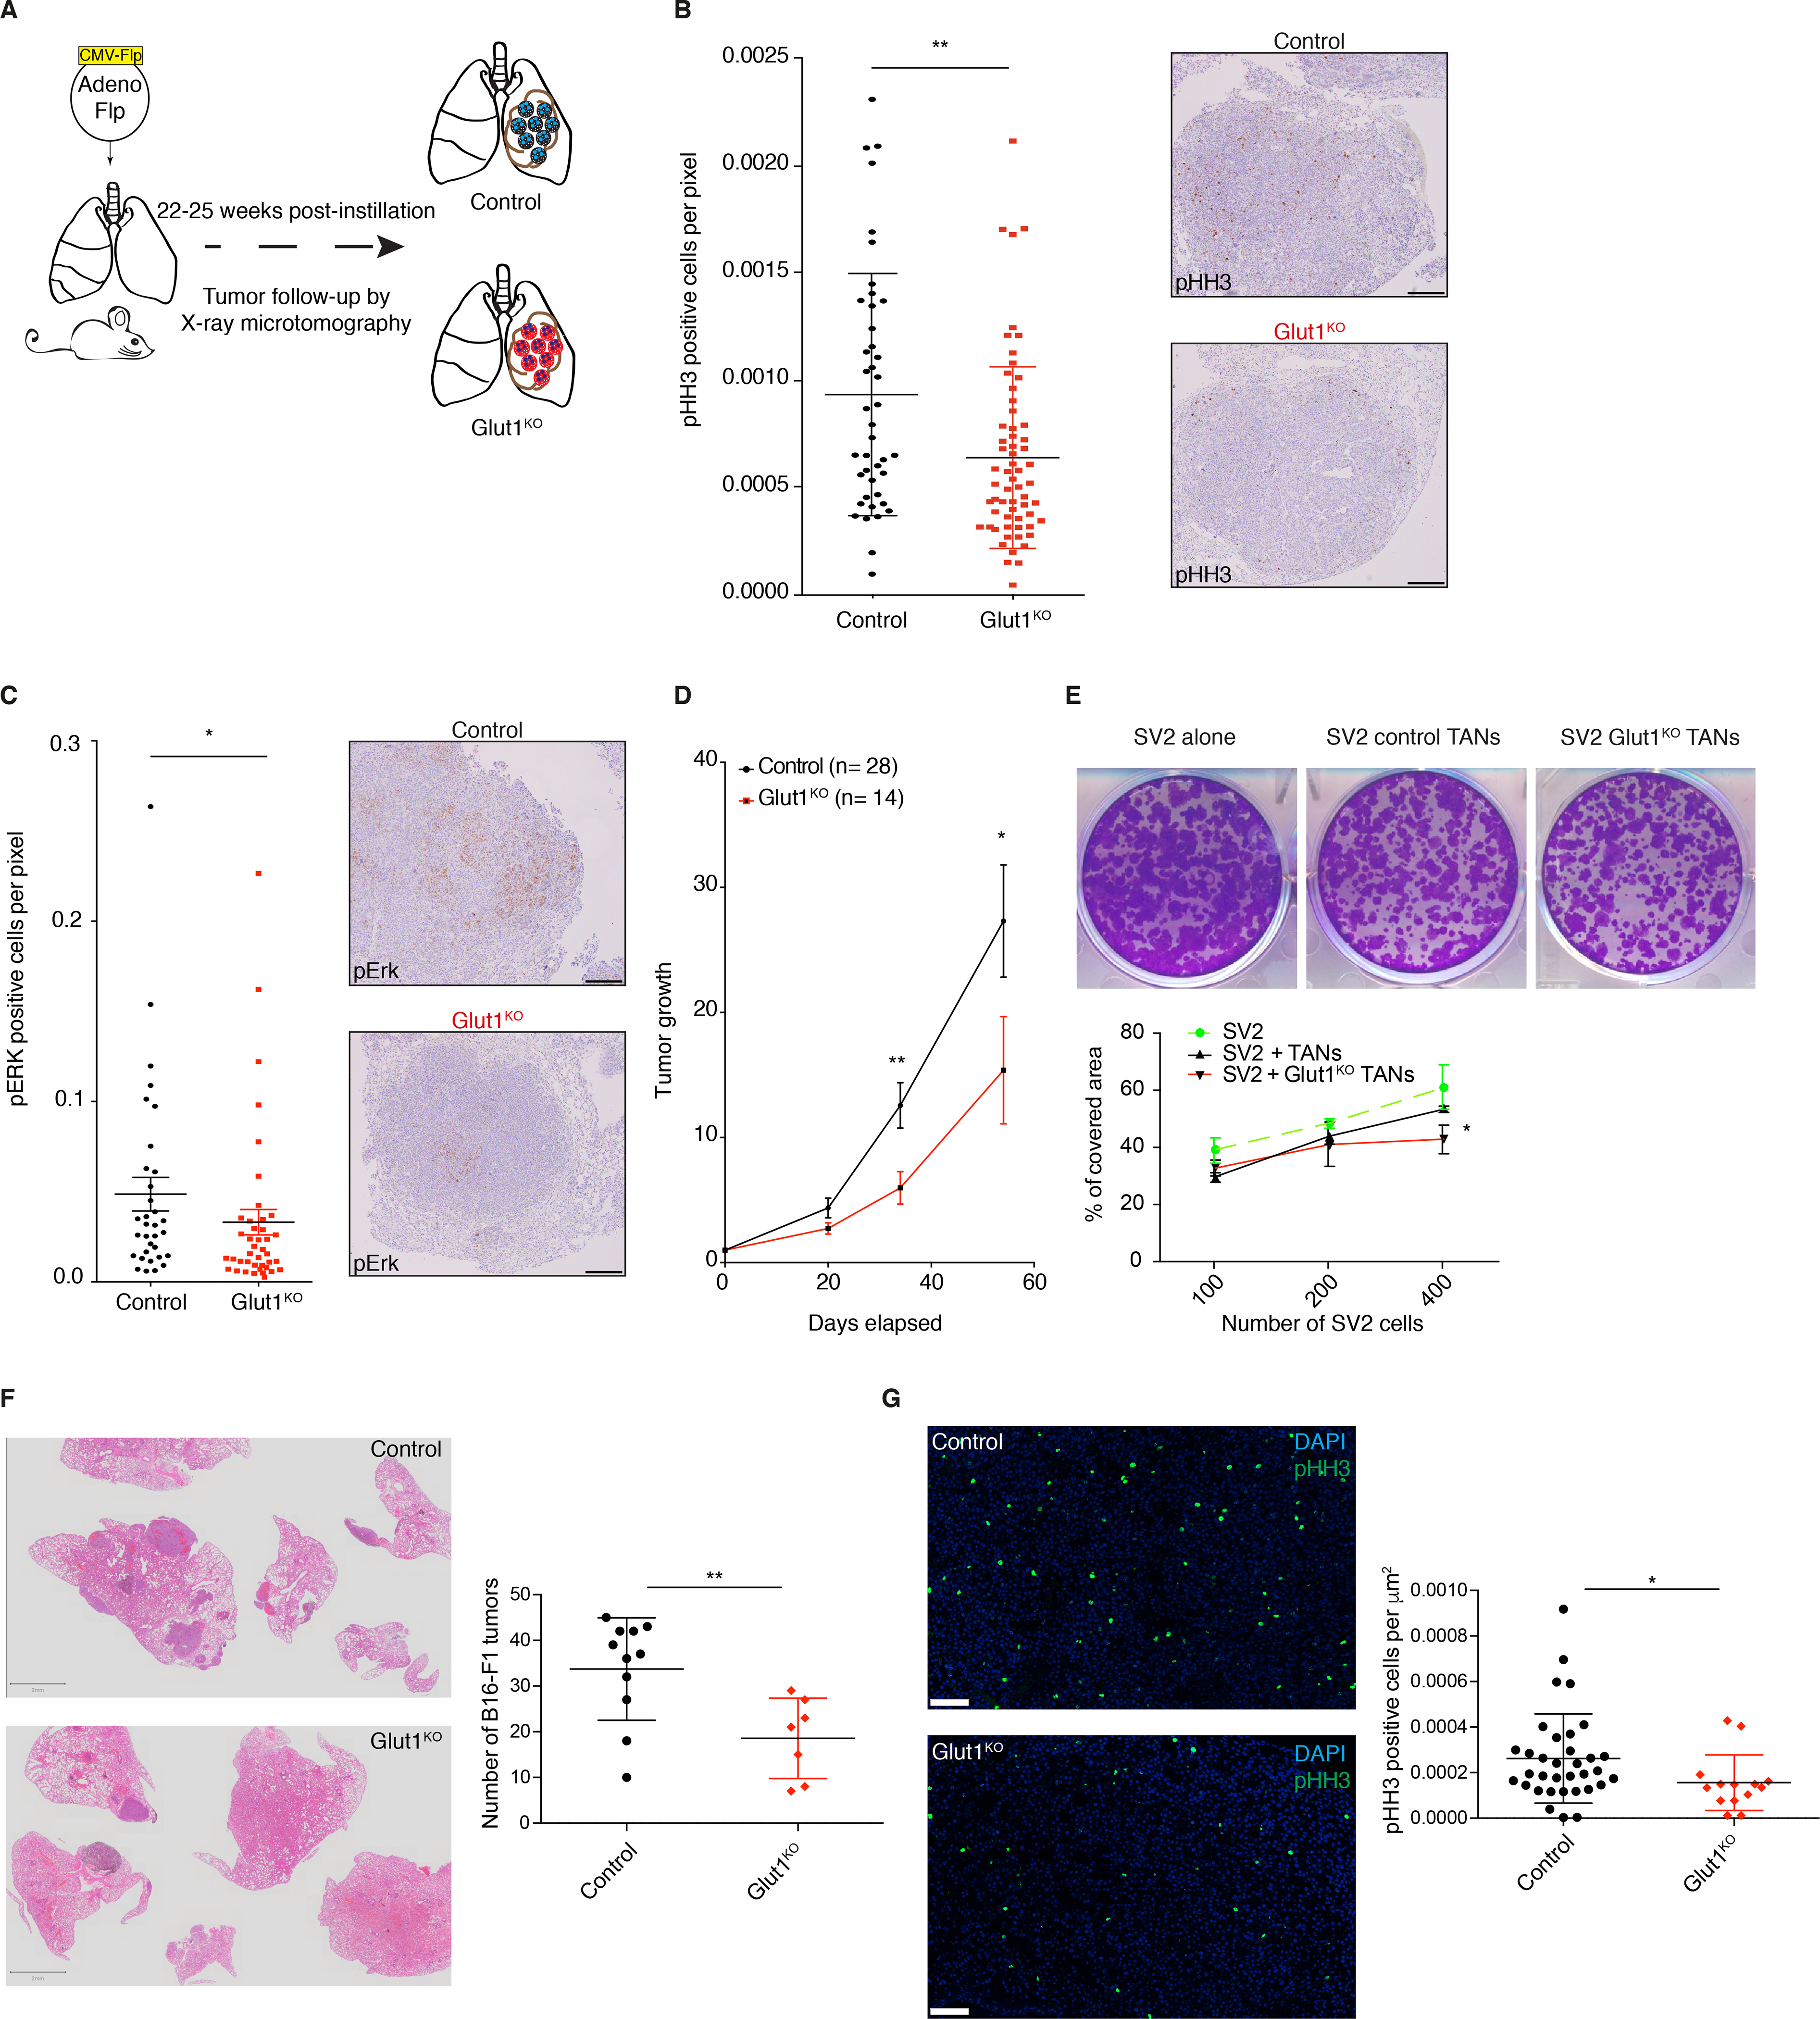
A) Schematic representation of the experiments. B) (left) Quantification of phospho-Histone H3 (pHH3) staining in Glut1KO or control tumors (mean ± s.d.). (right) Representative staining of pHH3 in tumors. Scale bars: 200 μm. C) (left) Quantification of phospho-ERK (pERK) staining in tumors (mean ± s.d.). (right) Representative staining of pERK in tumors. Scale bars: 200 μm. D) Long-term μCT analysis of tumor-bearing mice. Data represent tumor volumes (mean ± s.e.m.) normalized to the first volume (set to 1) of the same tumors in control or GLUT1KO. Control n= 28 tumors; Glut1KO n= 14 tumors. E) Representative images (upper panel) of the SV2 cell line spreading assay, cultured alone or in presence of control or Glut1KO TANs. (lower panel), cell-covered area quantification of SV2 cell lines cultured alone or in presence of control or Glut1KO TANs. F) Representative Hematoxylin and Eosin (H&E) staining of experimental lung metastases from B16-F1 melanoma cells (left panel, scale bars: 2 mm). (right panel) Tumor quantification. G) Representative pHH3 imunofluorescence staining (left panel, scale bars: 100 μm) and quantification (right panel).