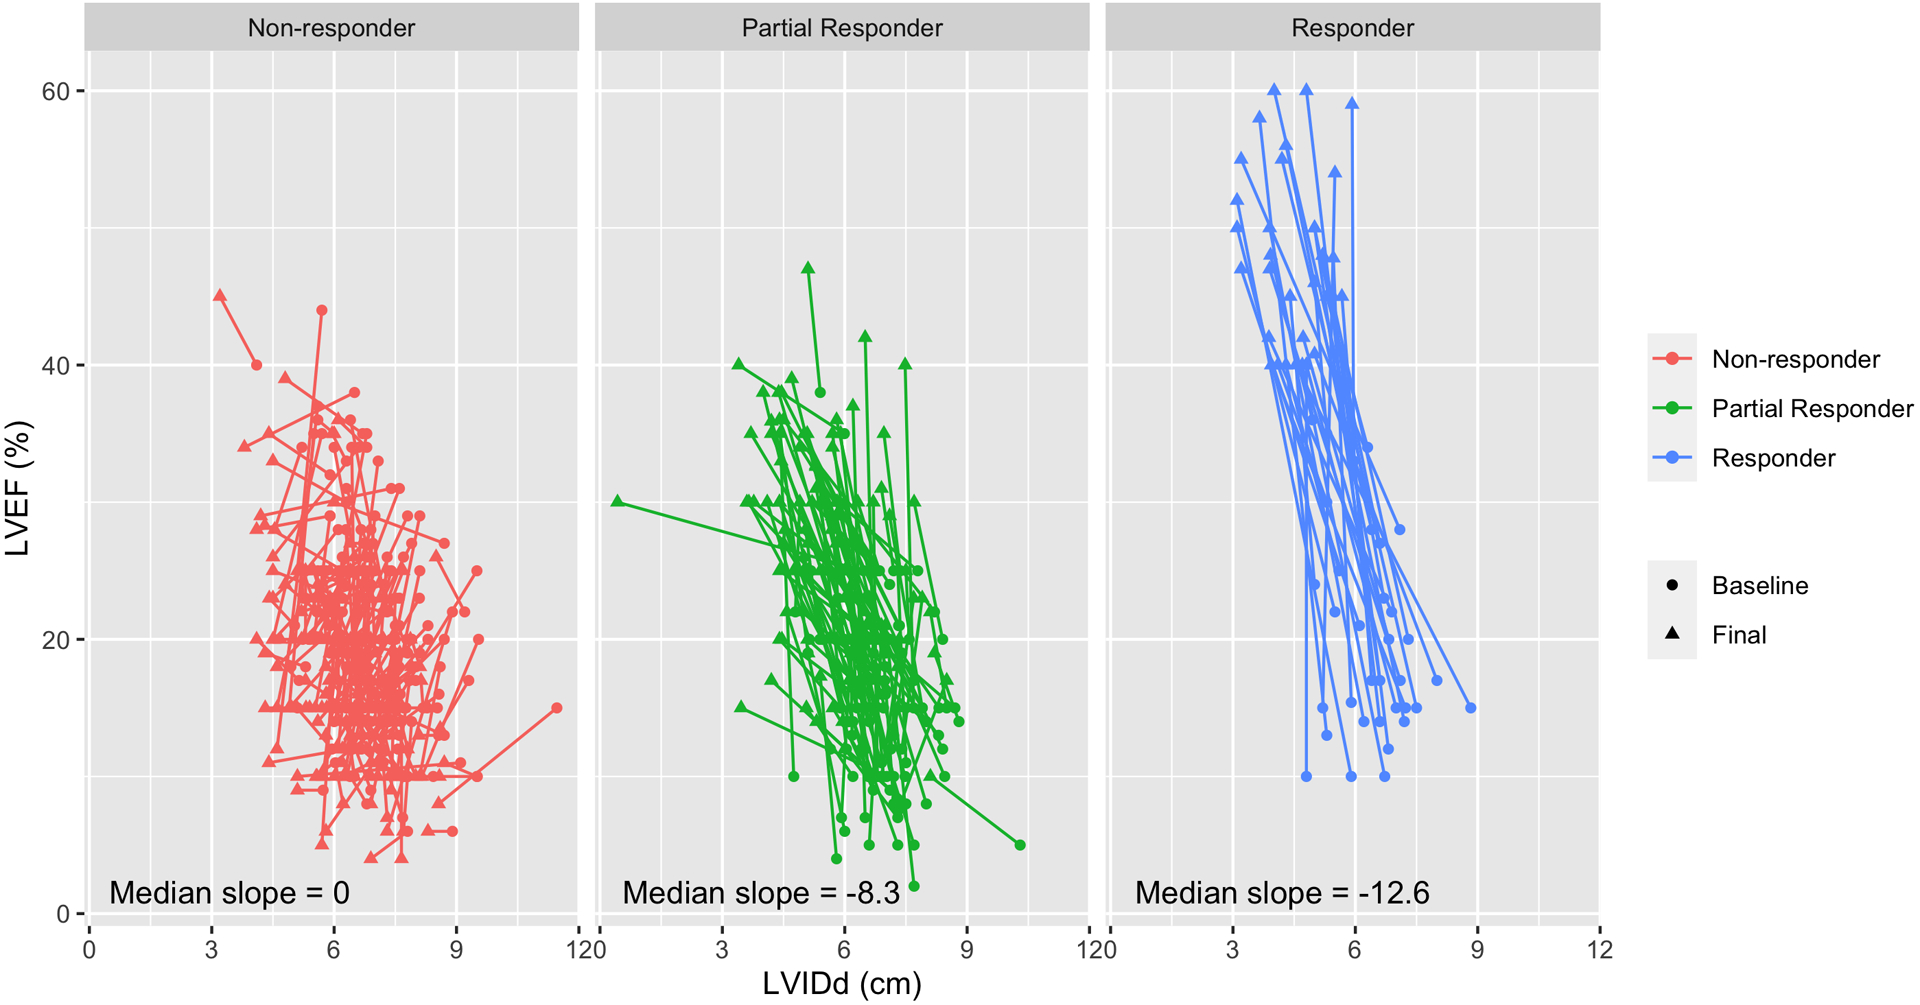
Figure 3. Slope of Reverse Cardiac Remodeling based on Responder Stage.

Visual depiction of the change in each patient’s left ventricular cavity size on the x-axis (LVIDd) and ejection fraction on the y-axis (LVEF) at baseline before and after mechanical unloading with an LVAD. The circle indicates the baseline LVIDd and LVEF and the arrow tip represents the final LVIDd and LVEF. Each color group represents the three responder categories. The slope of the change in LVEF over the change in LVIDd is provided. Increasing negative numbers suggest more significant reverse remodeling.
