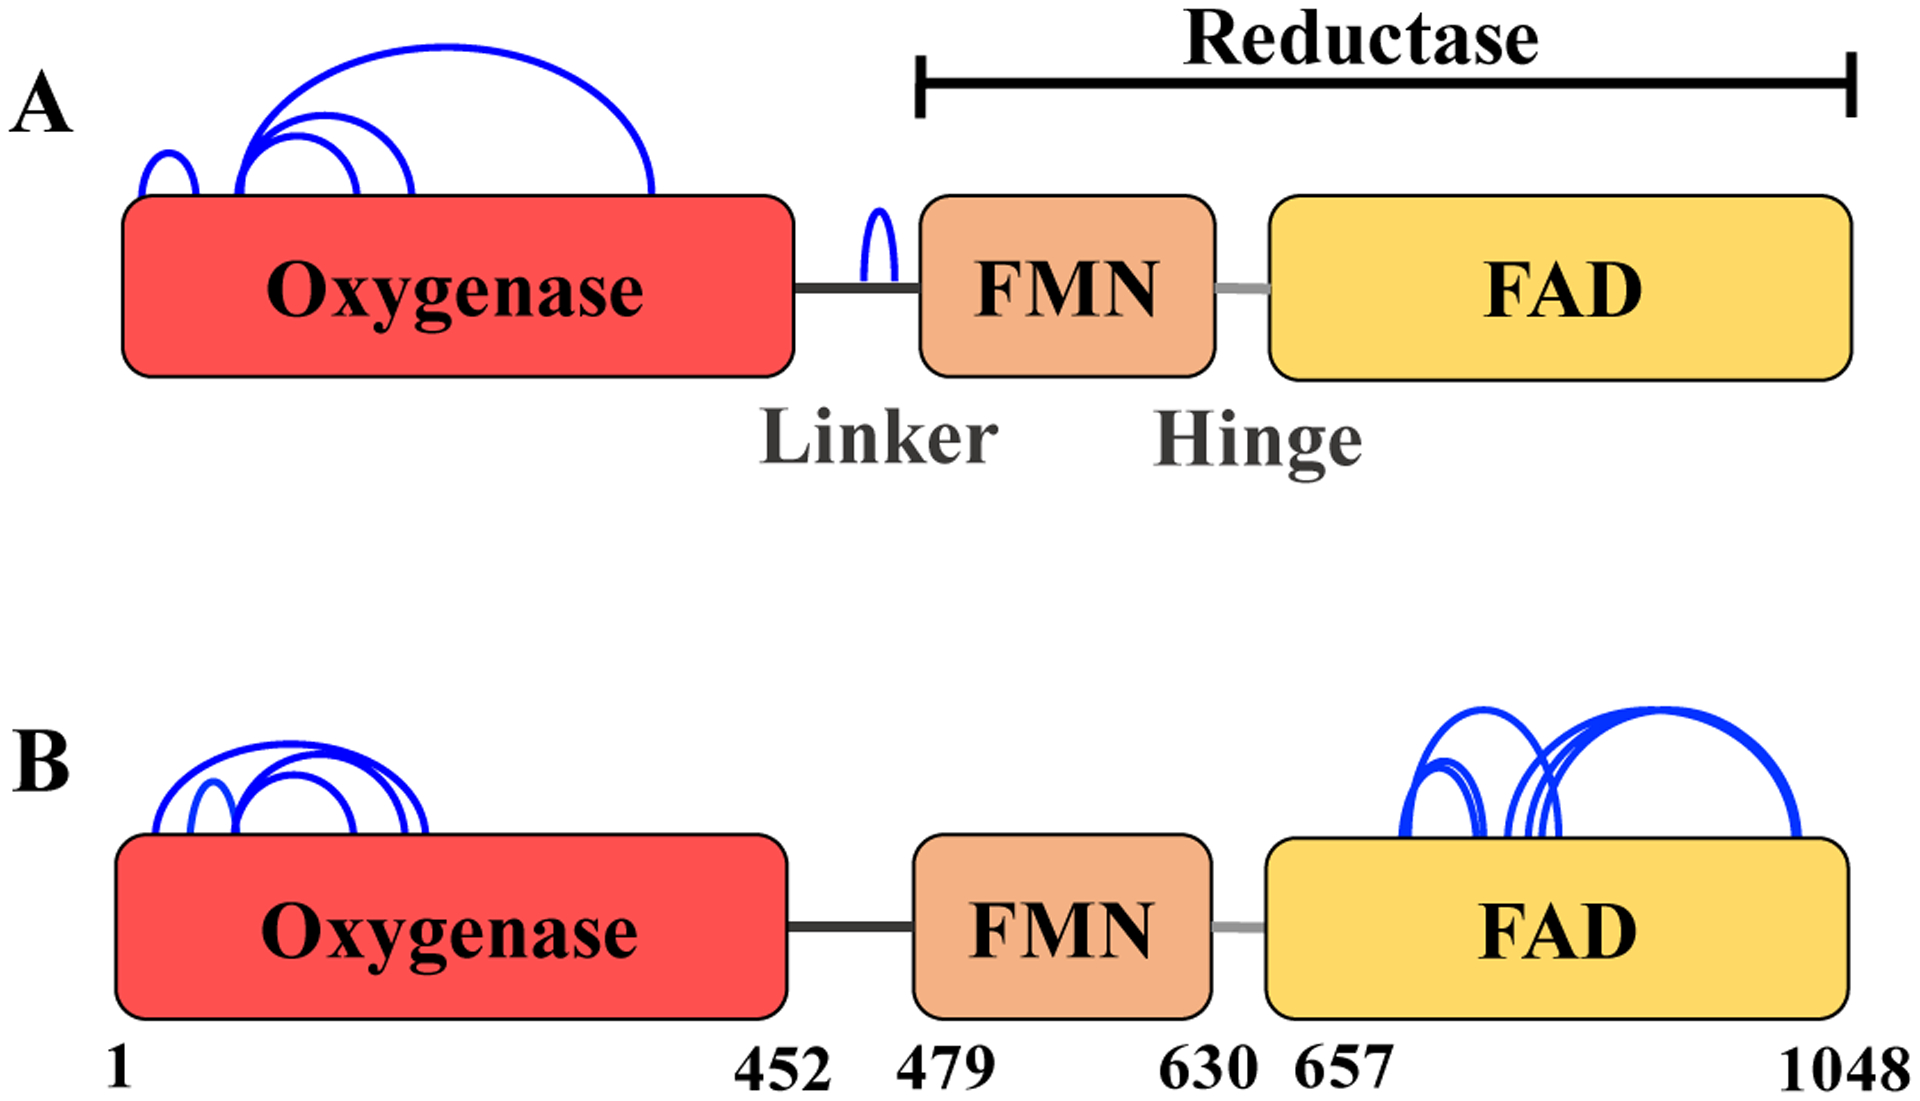
Figure 2. Schematic representation of the intra-monomer crosslinks found in the monomer band derived from CYP102A1 treated with DSBU for 5 min (A) or 15 min (B).

Blue arcs, crosslinks; red, oxygenase domain; orange, FMN domain; yellow, FAD domain. The FMN and FAD domains together represent the reductase domain.
