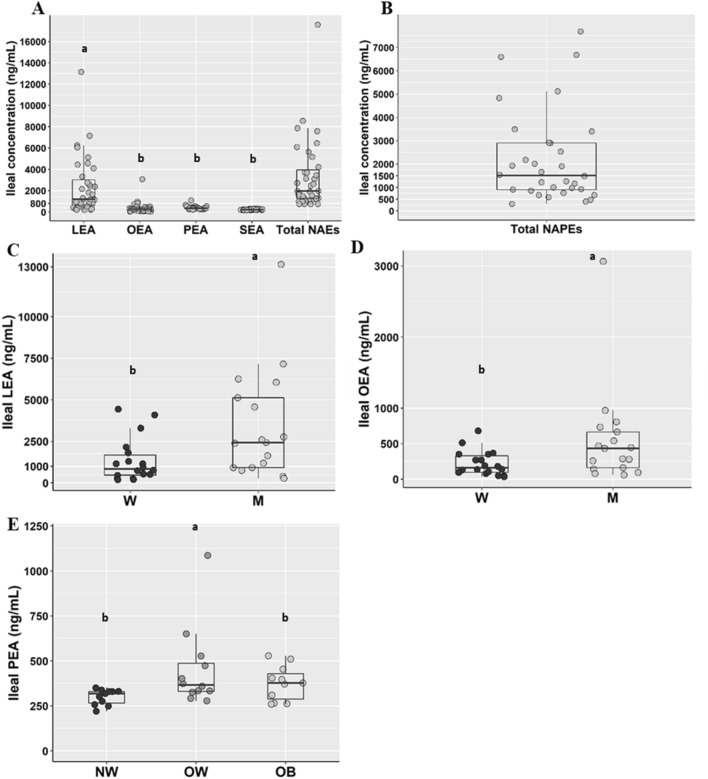
Fig. 2.
N-acylethanolamines (a) and N-acylphosphatidylethanolamines (b) concentrations in ileal fluids from the overall population (n = 35), LEA (c) and OEA (d) concentrations in ileal fluids from men (M, empty dots; n = 17) and women (W, solid dots; n = 18) and PEA (e) concentrations in ileal fluids from participants with normalweight (NW; n = 11), overweight (OW; n = 12) and obesity. Different letters on the box plots indicate p value < 0.05 by One-way ANOVA and Bonferroni adjustement for multiple comparisons or by Student’s t test. Total NAEs include the sum of LEA, OEA, PEA and SEA. LEA Linoylethanolamide, OEA oleoylethanolamide, PEA palmitoylethanolamide, SEA stearoylethanolamide, NAEs N-acylethanolammines, NAPEs N-acylphosphatidylethanolamines. The box plots show the data distribution based on first quartile, median and third quartile

