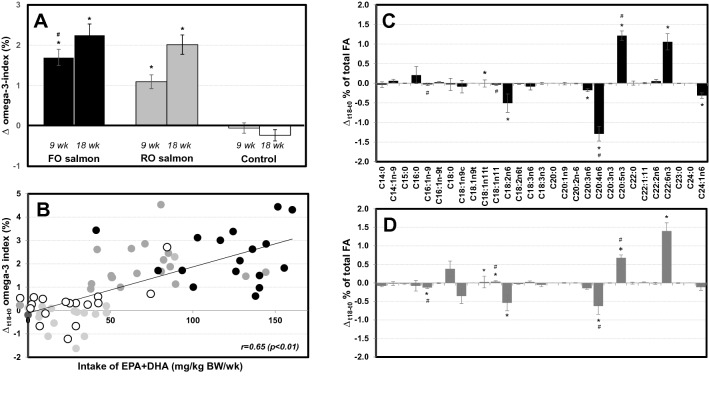
Fig. 2.
Changes in RBC fatty acid composition upon consumption of 2 portions of FO or RO salmon per week or no additional salmon (control), after 9 and 18 weeks. Data are means ± SEM. a: Change in O3I from baseline at 9 weeks and 18 weeks for FO salmon (black), RO salmon (gray), control (white) groups; *p < 0.01 for differences from control group; #p < 0.05 for difference between FO and RO salmon groups. b: Correlation of changes in O3I with the intake of EPA + DHA per kg of body weight across the FO salmon (black), RO salmon (gray) and control (white) groups after 18 weeks of intervention. Changes in the abundance of individual fatty acids in RBC upon consumption of c: FO (black) or d: RO (gray) salmon for 18 weeks. *p < 0.05 for differences from control group; #p < 0.05 for differences between FO and RO salmon groups

