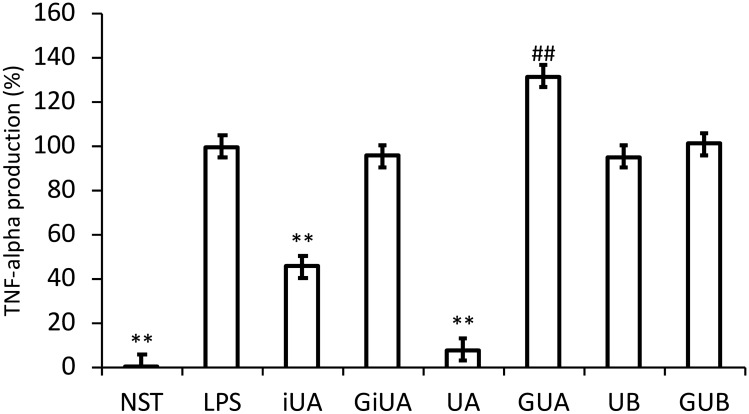
Fig. 3.
Effects of tested urolithins and respective glucuronides at the concentration of 40 μM on LPS-induced TNF-α. PBMCs were incubated with iso-urolithin A, urolithin A and B (iUA, UA, UB) and their respective glucuronides (GiUA, GUA, GUB) at the concentration of 40 μM and stimulated with LPS (100 ng/mL). Statistical significance: *p < 0.05, **p < 0.001 decrease versus stimulated control (Dunnettʼs post hoc test); #p < 0.05, #p < 0.001—statistically significant increase versus stimulated control; LPS—stimulated control; NST—non-stimulated control. Data are expressed as mean ± SD of three separate experiments performed in triplicate. Mean ± SD and p values are provided in Supplementary material Table S5

