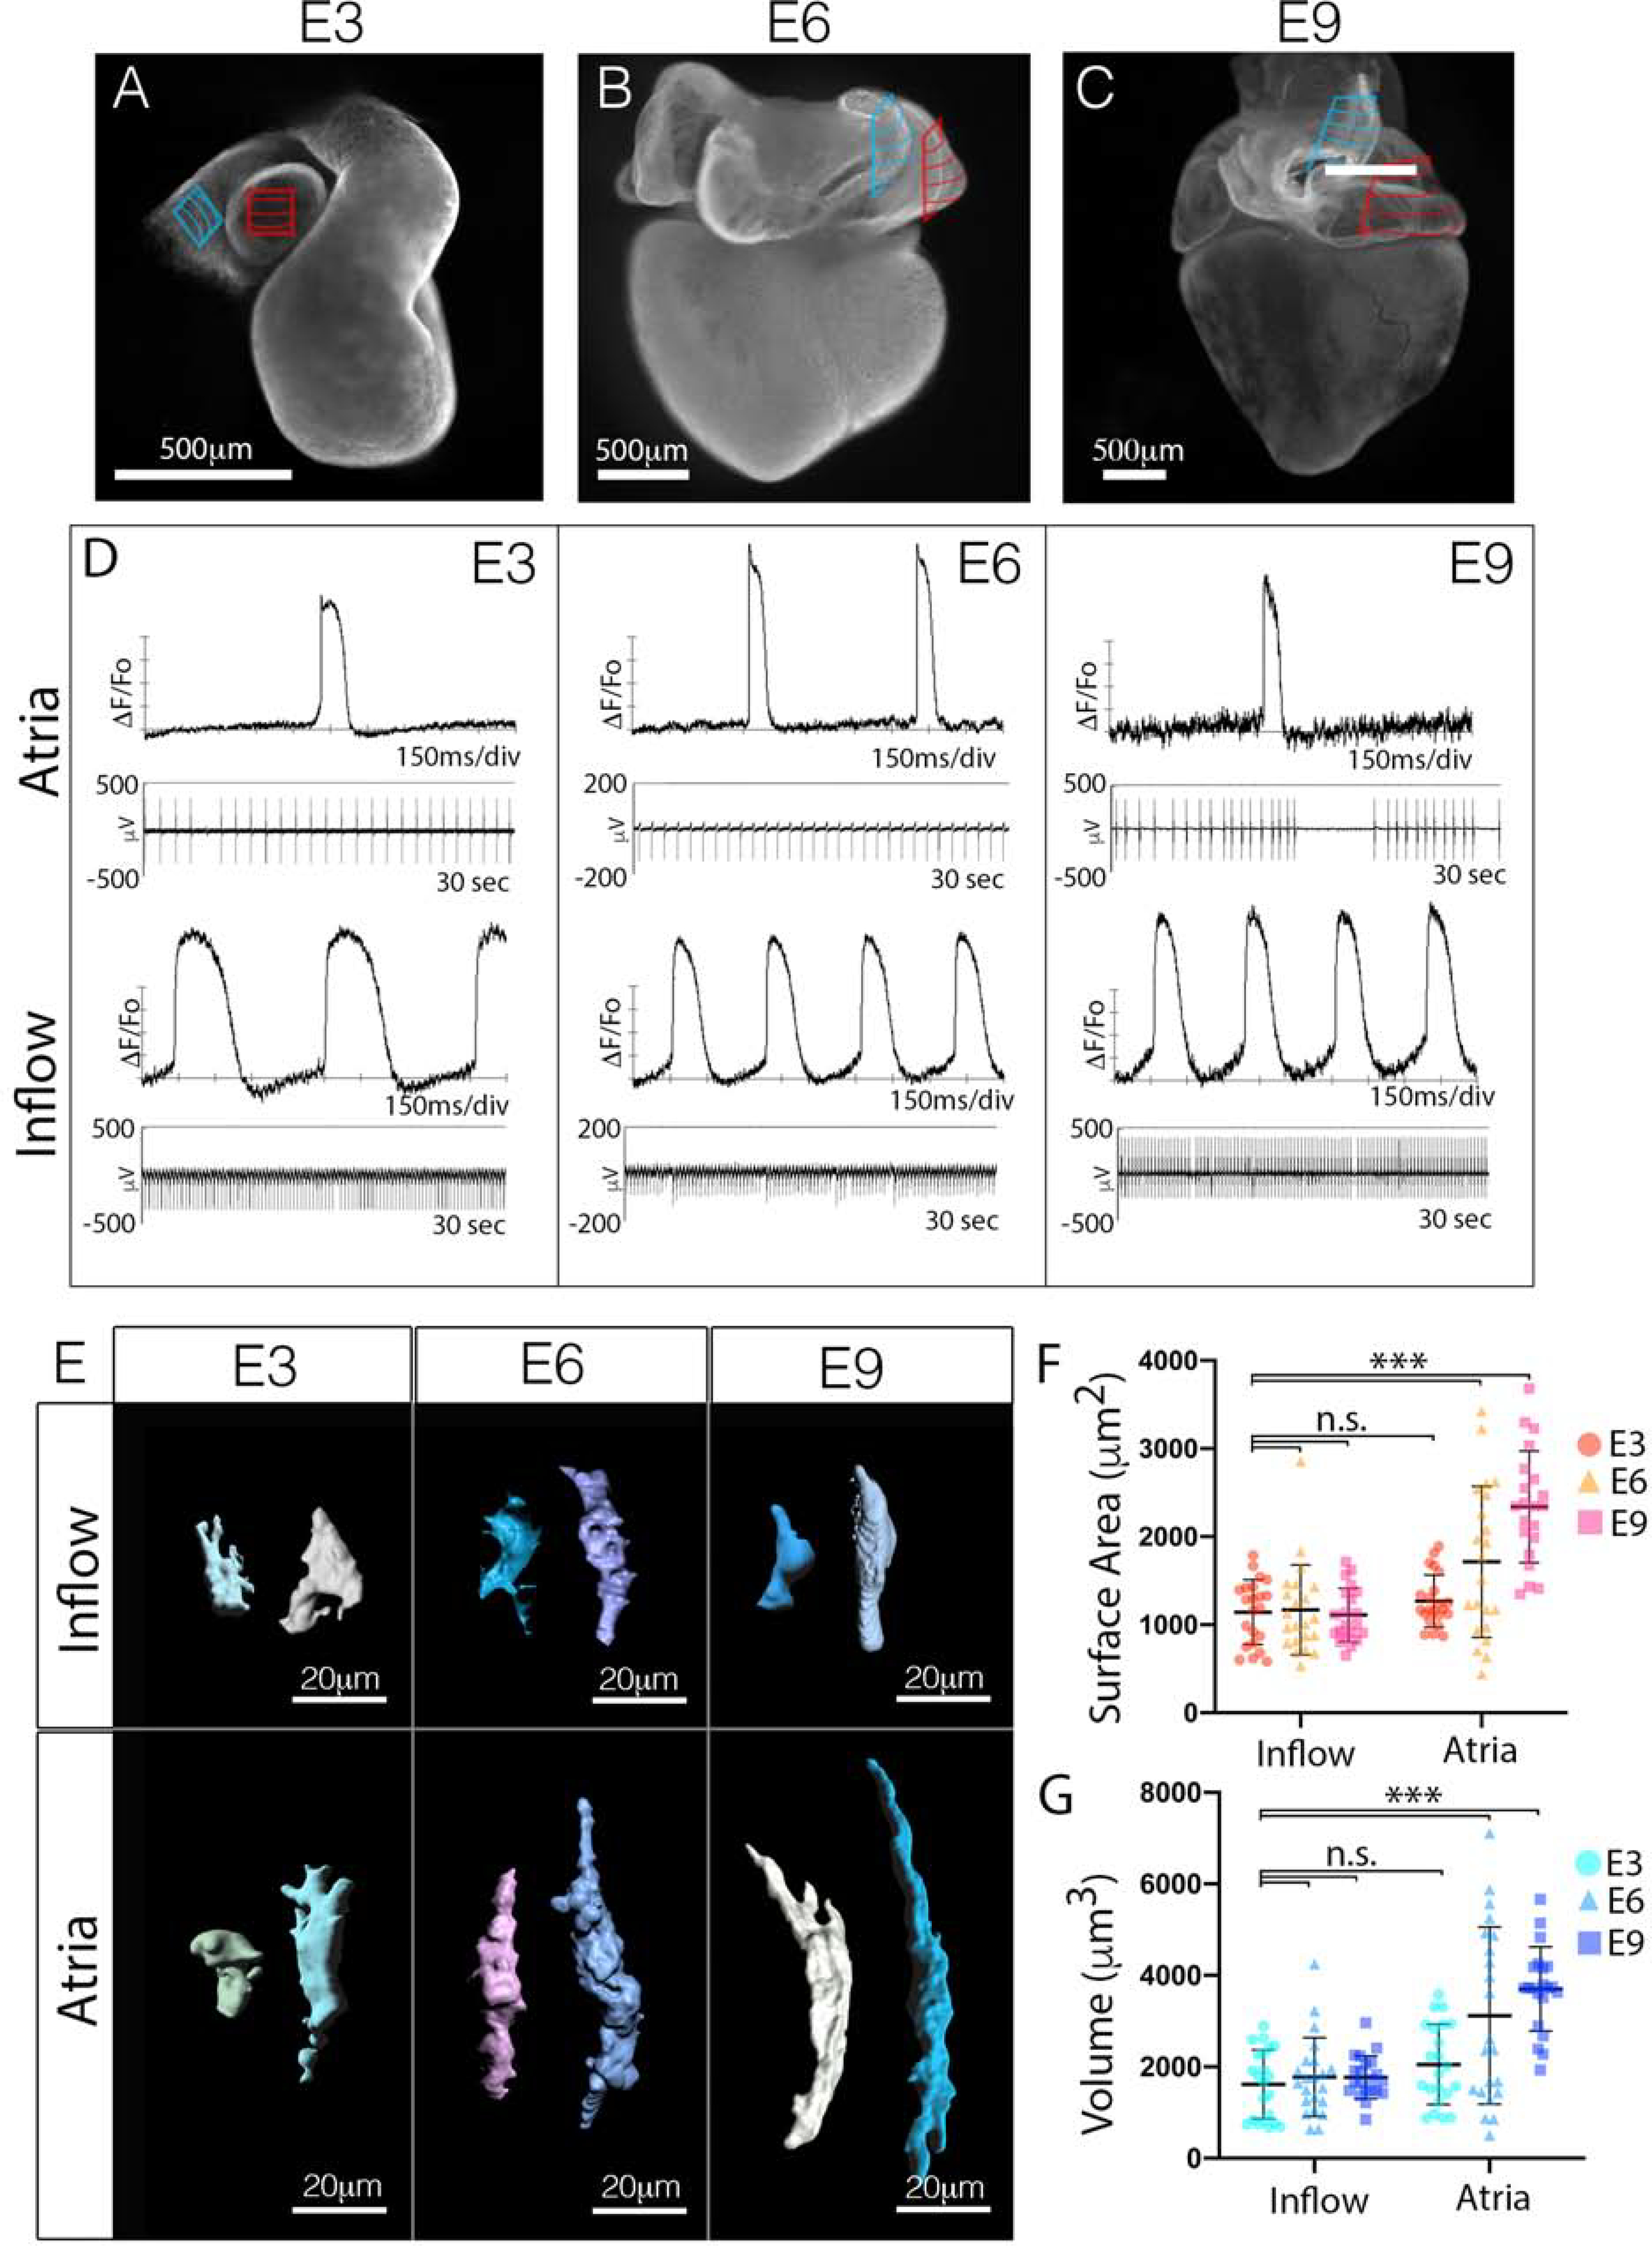
Figure 2. Cell size is differentially regulated between the CPC and WM lineages during cardiac morphogenesis.

A-C) Whole mount staining for the muscle marker MF20 at embryonic day 3 (A), embryonic day 6 (B), and embryonic day 9 (C). The location of the CPCs within the inflow myocardium is indicated by the blue hatched area, the atrial WM used for size analysis is indicated by the red hatched area. D) Voltage sensitive dye-based (top) and micro-electrode array (MEA) (bottom) recordings of electrical activity from isolated segments of tissues (blue and red regions from (A-C)). Scale bar – 500μm. E) Volumetric reconstruction of CPCs from the inflow and atrial WM at different stages of cardiac morphogenesis (See also Figure S1). F) Quantification of surface area of CPCs from the inflow and atrial WM at different stages of cardiac morphogenesis (n=129). G) Quantification of cell volume of CPCs from the inflow and atrial WM at different stages of cardiac morphogenesis (n=129). Mean +/− SD are indicated by line and bars for F and G.
