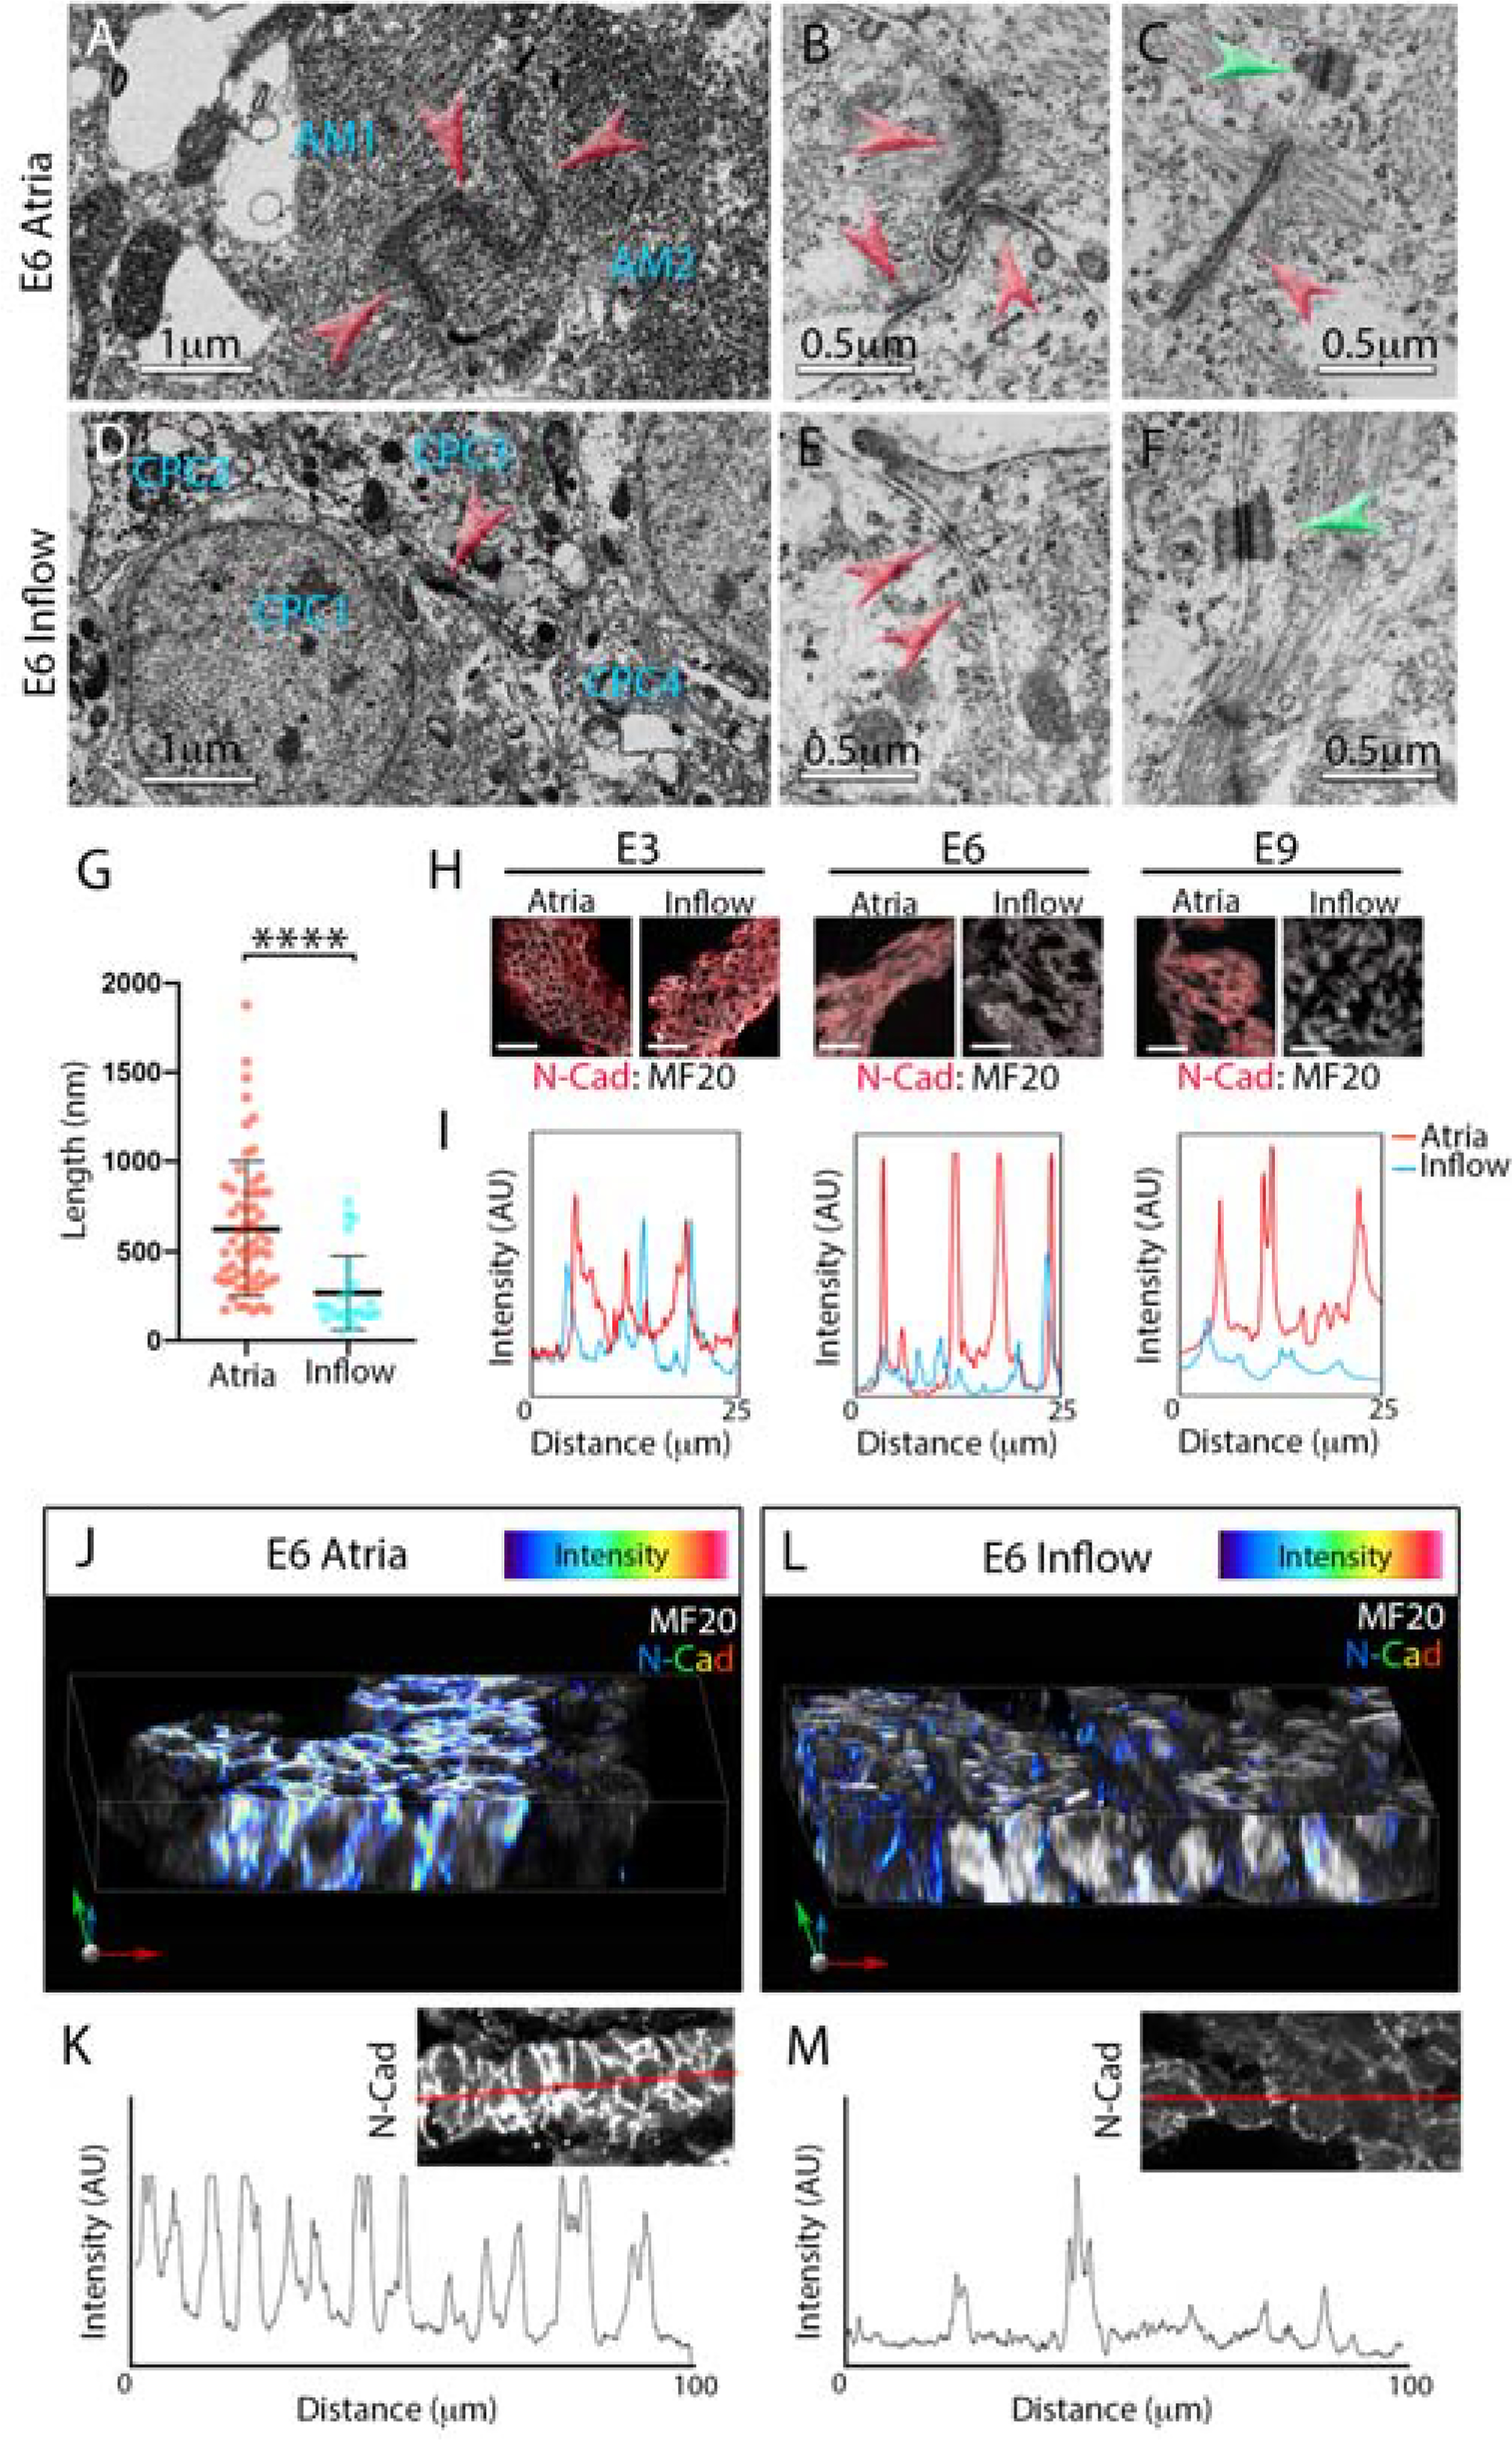
Figure 3. CPCs uniquely lose the capacity to form adherens junctions as they structurally diverge from the working myocardium.

A) Transmission electron microscope (TEM) image of two atrial myocytes (AM1 and AM2). Red arrowheads indicate a series of adherens junctions (AJs) between the two myocytes. B) Higher magnification image of a series of AJs between three atrial myocytes (red arrowheads), these structures are tethered to large bundles of actin filaments. C) Within the atrial WM, AJs are often associated with nearby desmosomes (green arrowhead). D) TEM image of four CPCs (CPC1–4) located within the inflow myocardium. These cells have low sarcomere density consistent with adult CPCs. Note: only one junction is present between the four cells (red arrowhead). E) Higher magnification image of membrane interface between two inflow cells, small electron dense structures that are not tethered to actin are present (red arrowheads). F) Typical desmosome present between inflow myocytes (green arrowhead). G) Quantification of measured AJs length based on TEM images (n=89). Mean +/− SD are indicated by line and bars. H) Immunolocalization of the AJ protein, N-cadherin (N-Cad, red), within E3, E6, and E9 atrial and inflow myocardium. Sections are counterstained with MF20 (white). Scale bar – 25μm. I) Line scan profile comparing intensity of atrial (red trace) and inflow (blue trace) N-Cad staining at E3, E6, and E9. J) Reconstruction of a 30μm Z-stack of atrial WM taken from a 200μm thick vibratome section. N-Cad intensity is color coded. K) Line scan of N-Cad staining taken from a 200μm section of atrial tissue. Inset shows N-Cad staining, red line indicates position of the line scan. L, M) As in (K,L) for inflow myocardium.
