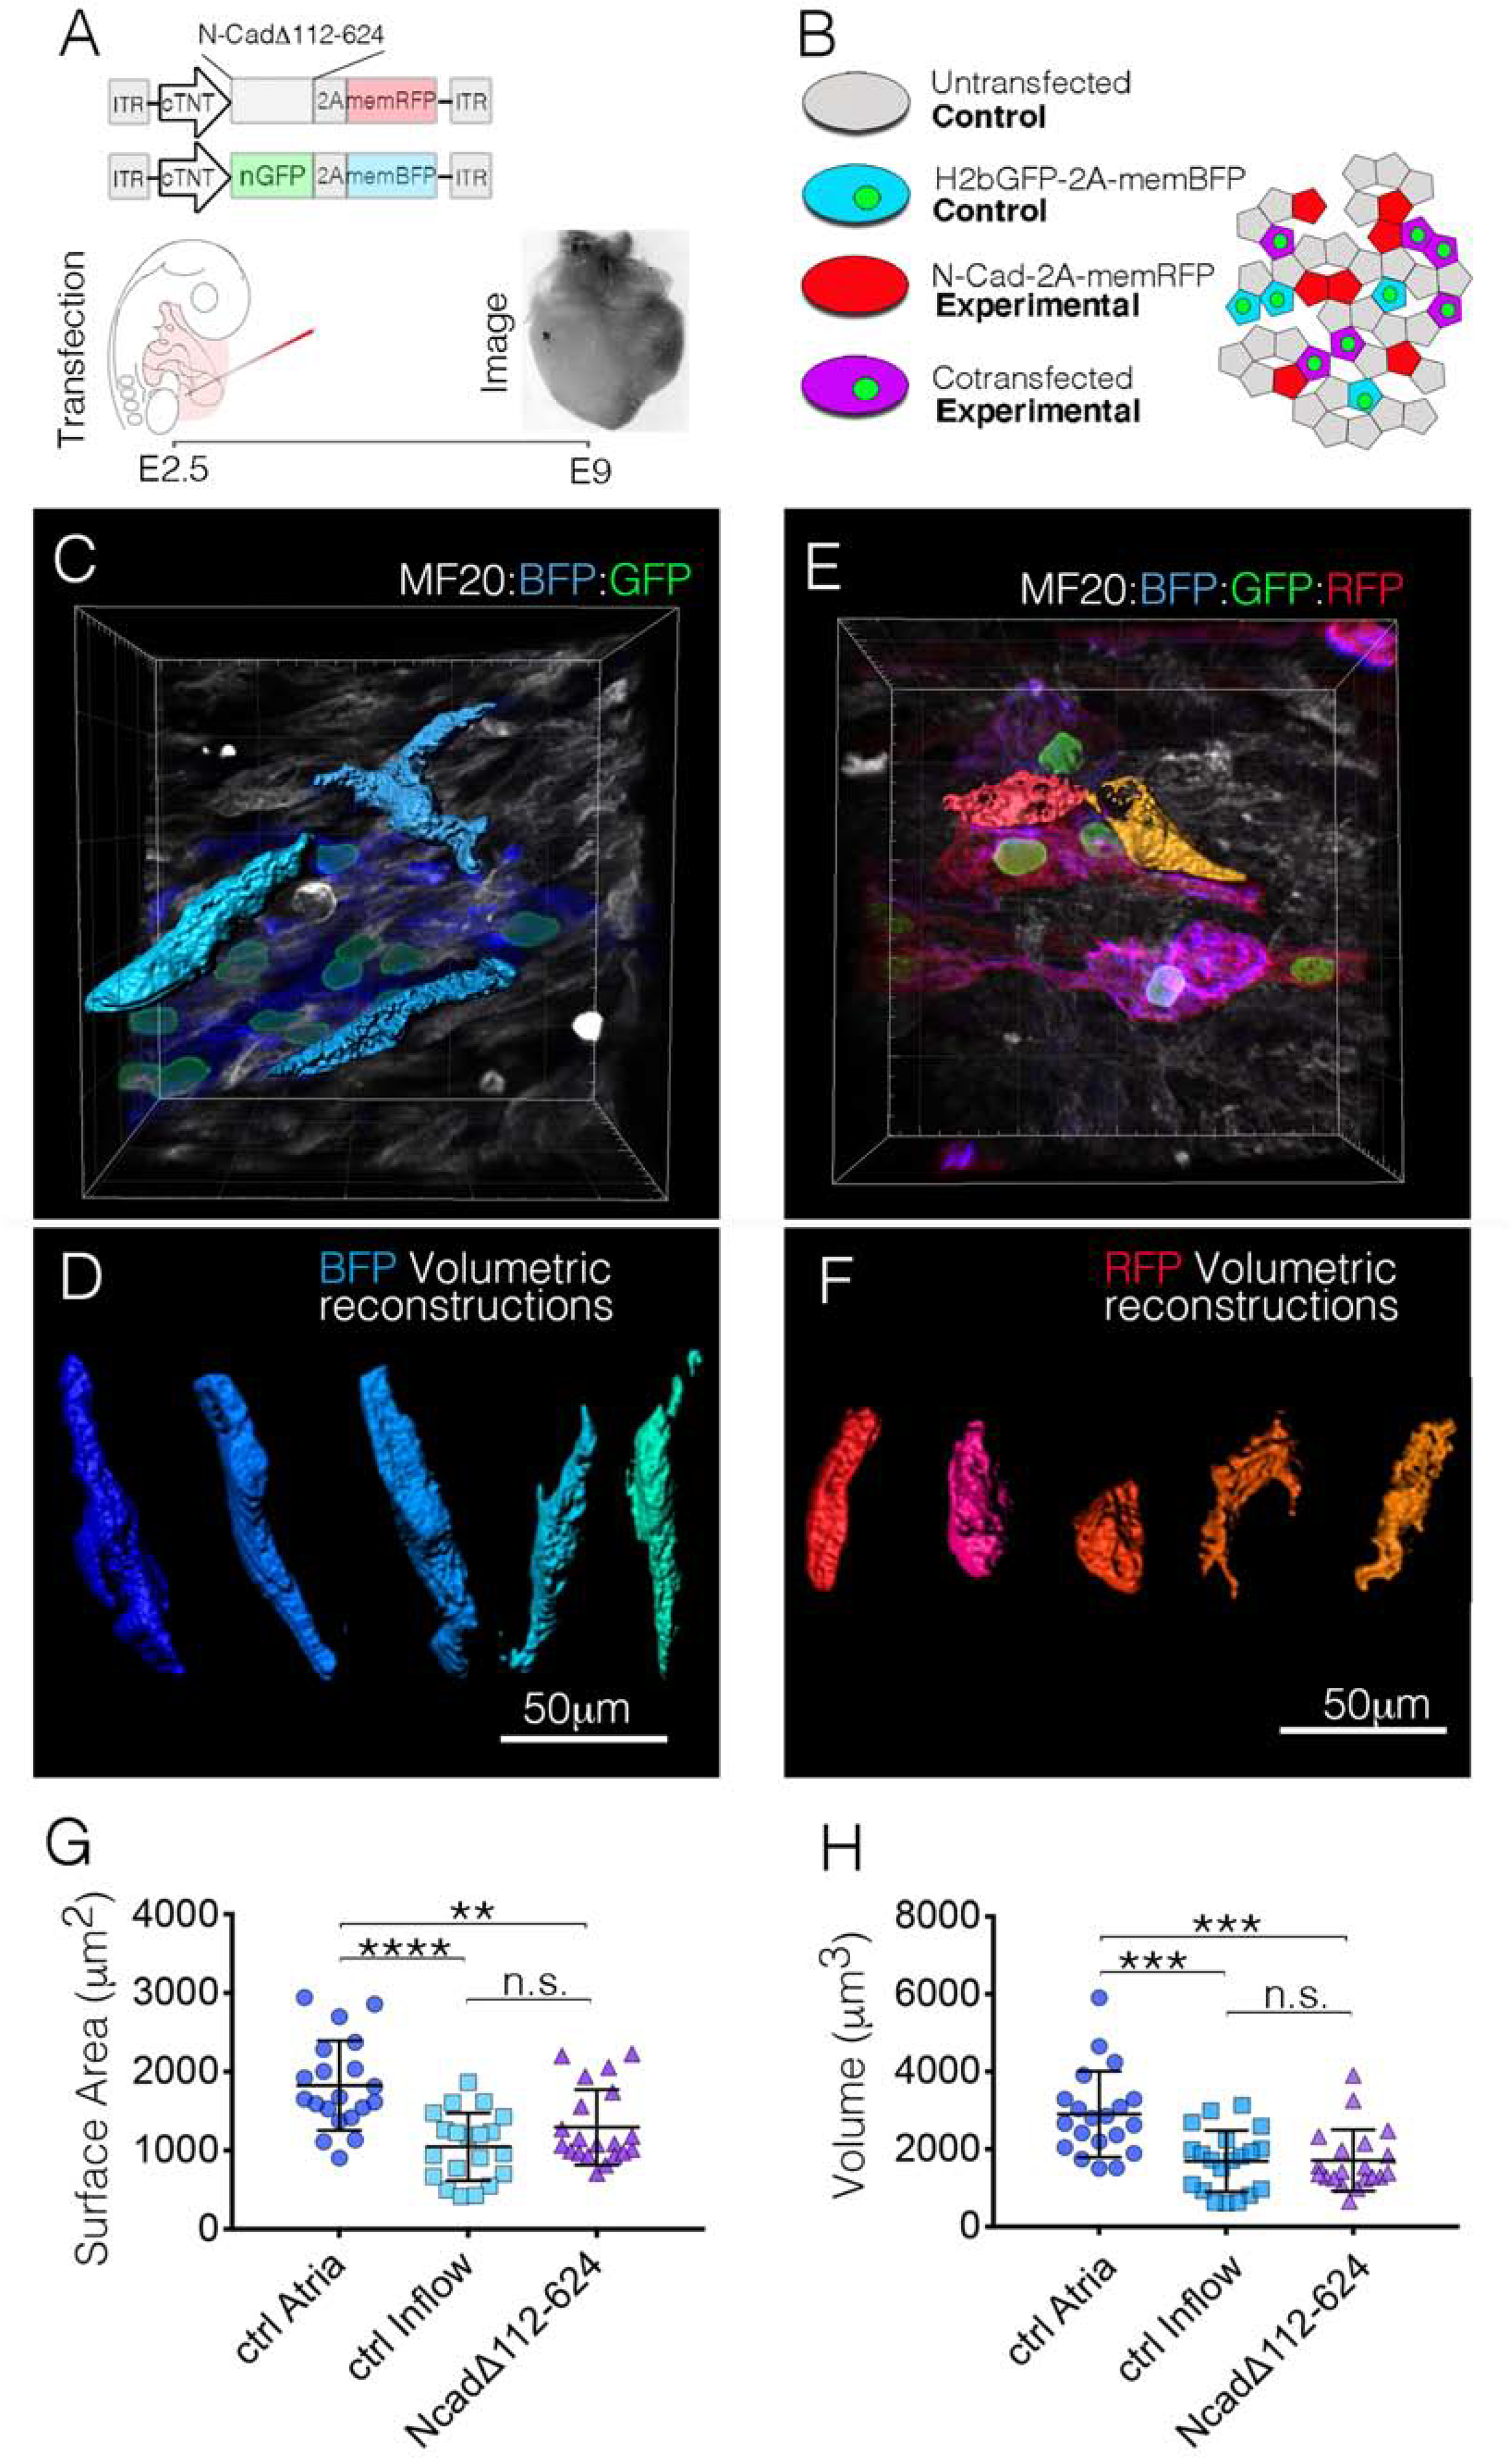
Figure 4. Inhibition of the cardiac AJ converts atrial WM to a CPC-like morphology.

A) Diagram of the experimental procedure for in vivo mosaic inhibition of AJ formation. B) Following manipulation, several cell populations are present in each heart. Control cells (nuclear GFP – Membrane BFP) were compared with experimental cells (nuclear GFP – Membrane BFP / N-CadΔ112–624 – membrane RFP). C) in vivo imaging of control (nuclear GFP – Membrane BFP) atrial WM. Three of these cells were digitally isolated for volumetric reconstruction. D) Examples of in vivo volumetric reconstructions from control atrial WM. Scale Bar – 50μm E) in vivo imaging of experimental (nuclear GFP – Membrane BFP/N-CadΔ112–624 – membrane RFP) atrial WM. F) Typical examples of volumetric reconstructions from experimental cells. G) Quantification comparing surface area between control atrial WM (n=20), control inflow CPCs (n=20), and N-CadΔ112–624 expressing atrial WM (n=20). H) Quantification comparing cellular volume between control atrial WM (n=20), control Inflow CPCs (n=20), and N-CadΔ112–624 expressing atrial WM (n=20). Mean +/− SD are indicated by line and bars for G and H.
