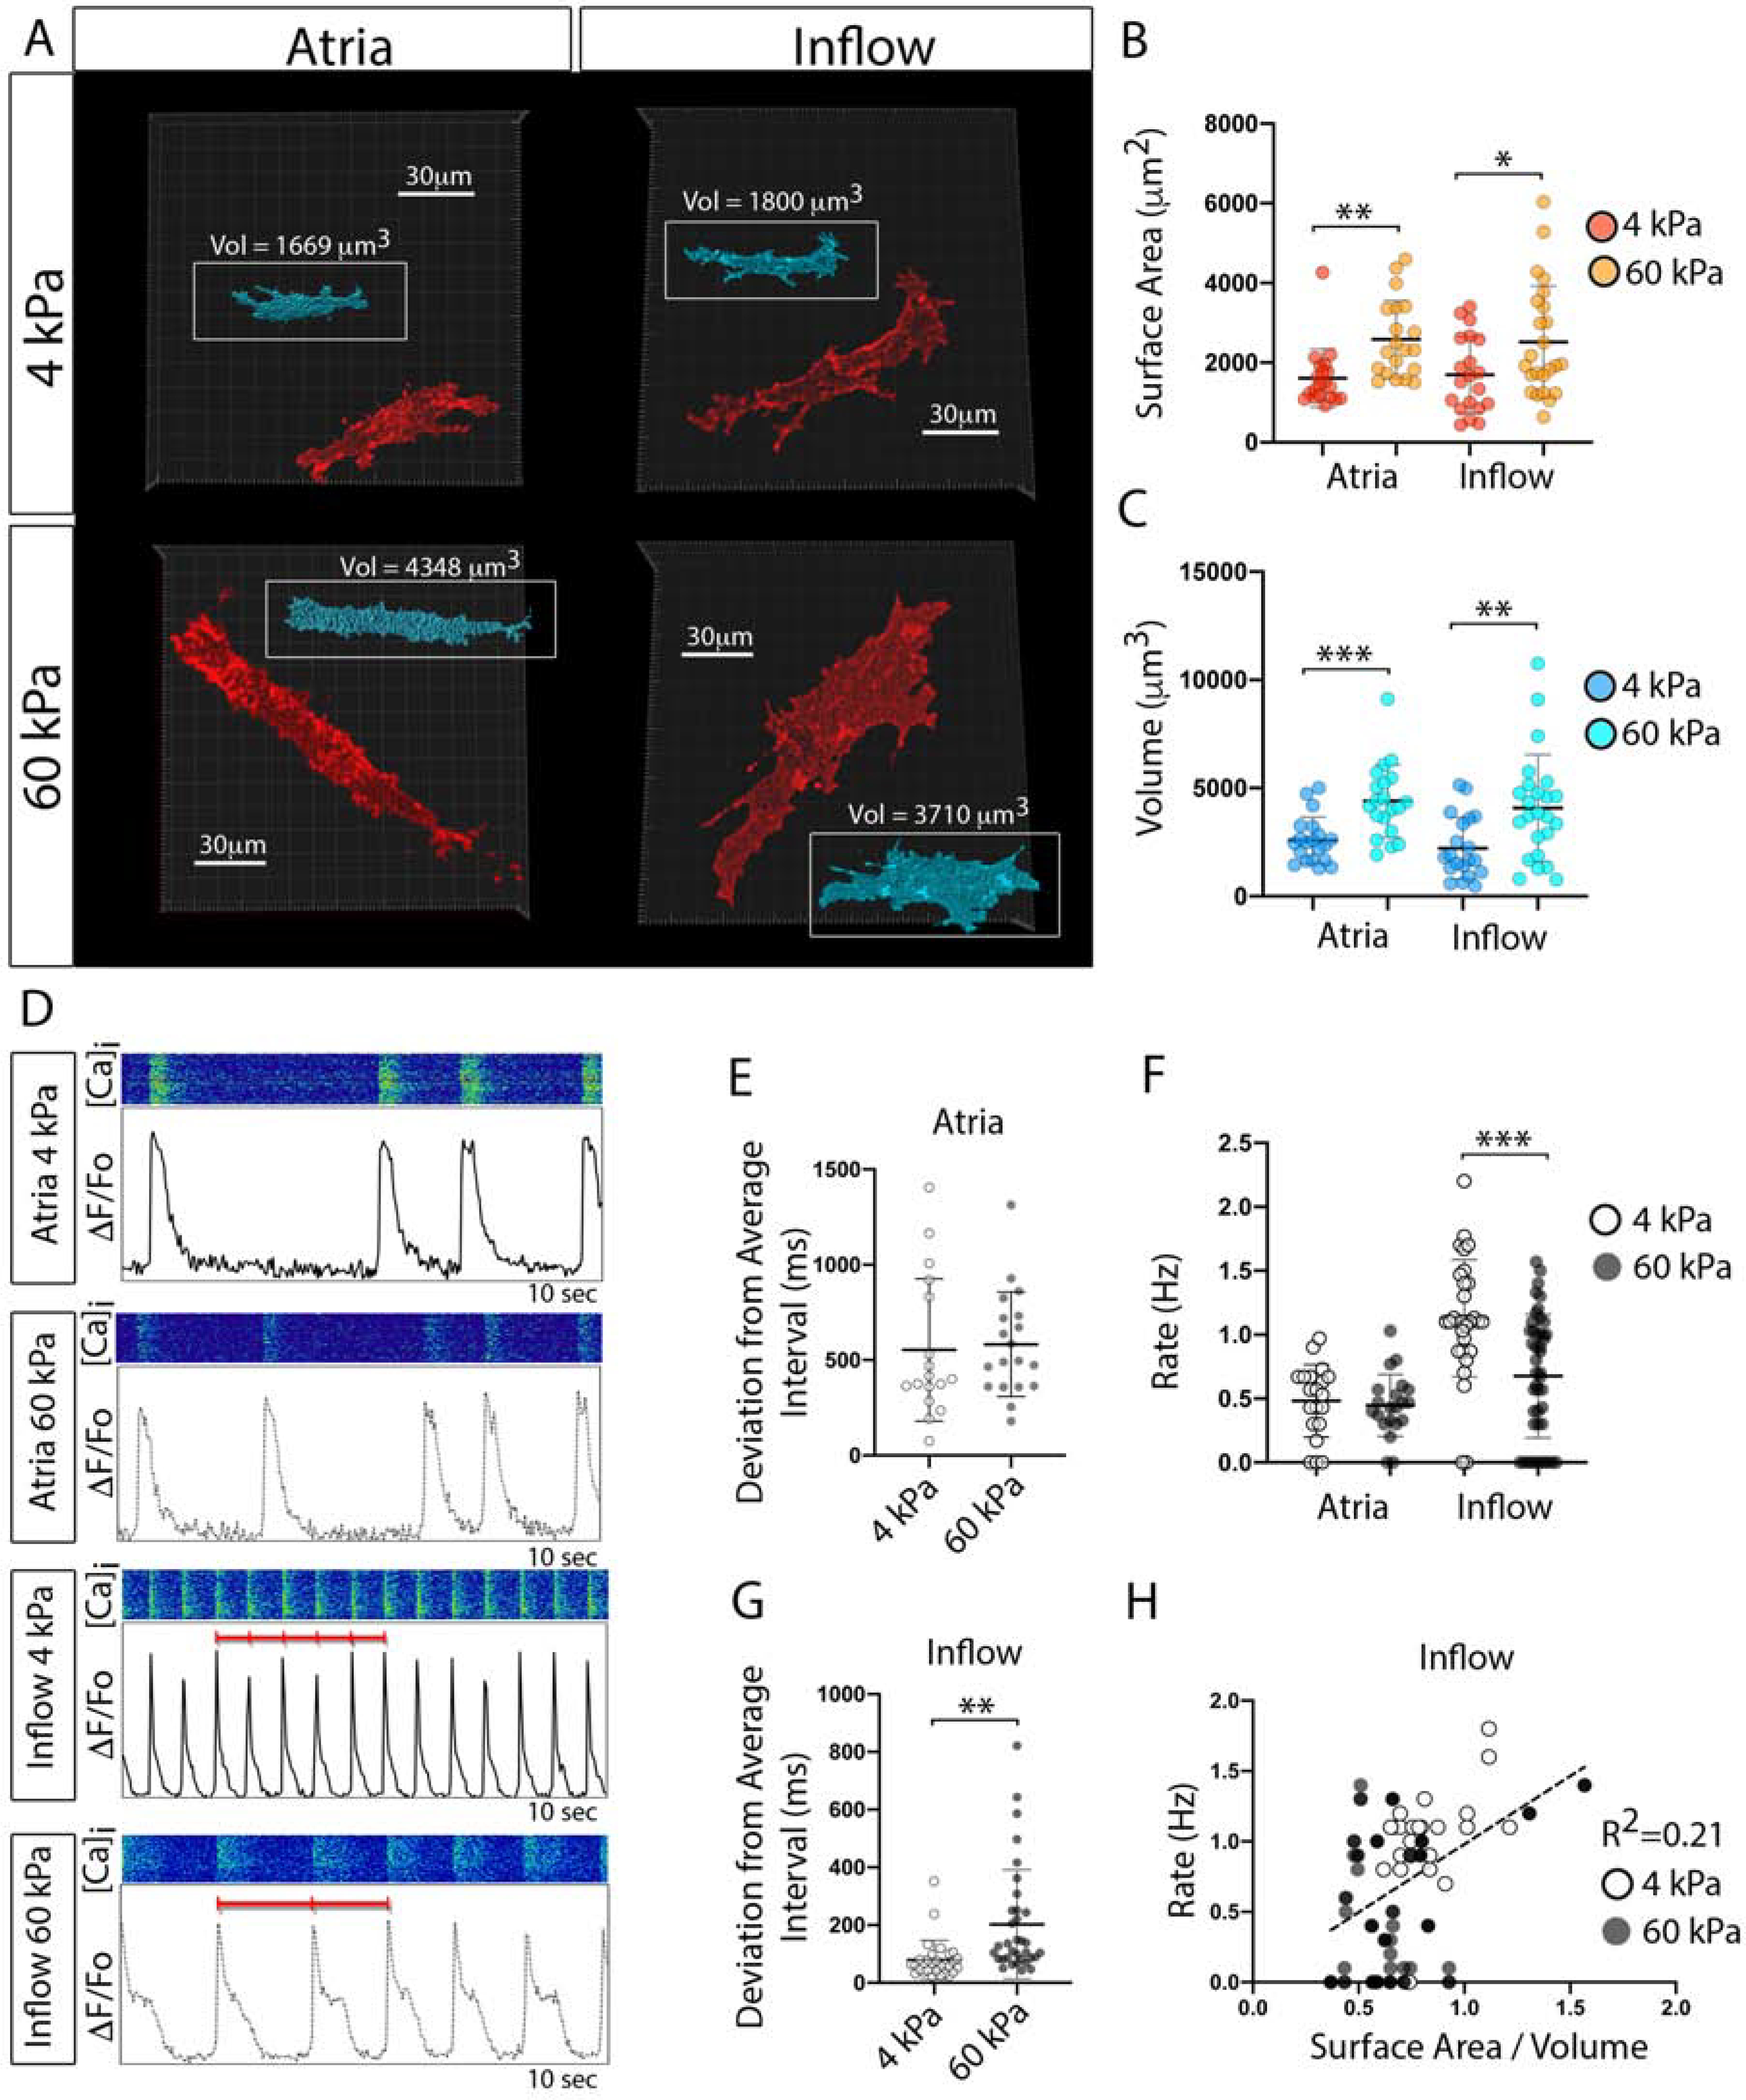
Figure 5. Force-mediated AJ engagement induces a WM-like phenotype in CPCs.

A) Maximum projection images of membrane RFP positive atrial WM and inflow cells cultured on 4kPa and 60kPa N-Cad cross-linked, polyacrylamide gels. Insets (Blue) show volumetric reconstructs of each cell. Scale Bar - 30 μm. B) Quantification of surface area of cells cultured as described for “A” (n=40 for atria, n=44 for inflow). C) Quantification of cellular volume for cells cultured as described in “A” D) Examples of typical physiological behavior of cells from “A-C.” Intracellular calcium transients were recorded from cells cultured on different stiffnesses of N-Cad coated gels. E) Quantification of variation in transient interval on different gel stiffness for atrial cells (n=40). F) Quantification of rate of activation (n=40 for atria, n=44 for inflow). G) Quantification of variation in transient interval on different gel stiffness for inflow cells (n=44). H) Linear regression between inflow cells surface area/volume ratio and rate of activity. Mean +/− SD are indicated by line and bars for B,C,E,F, and G.
