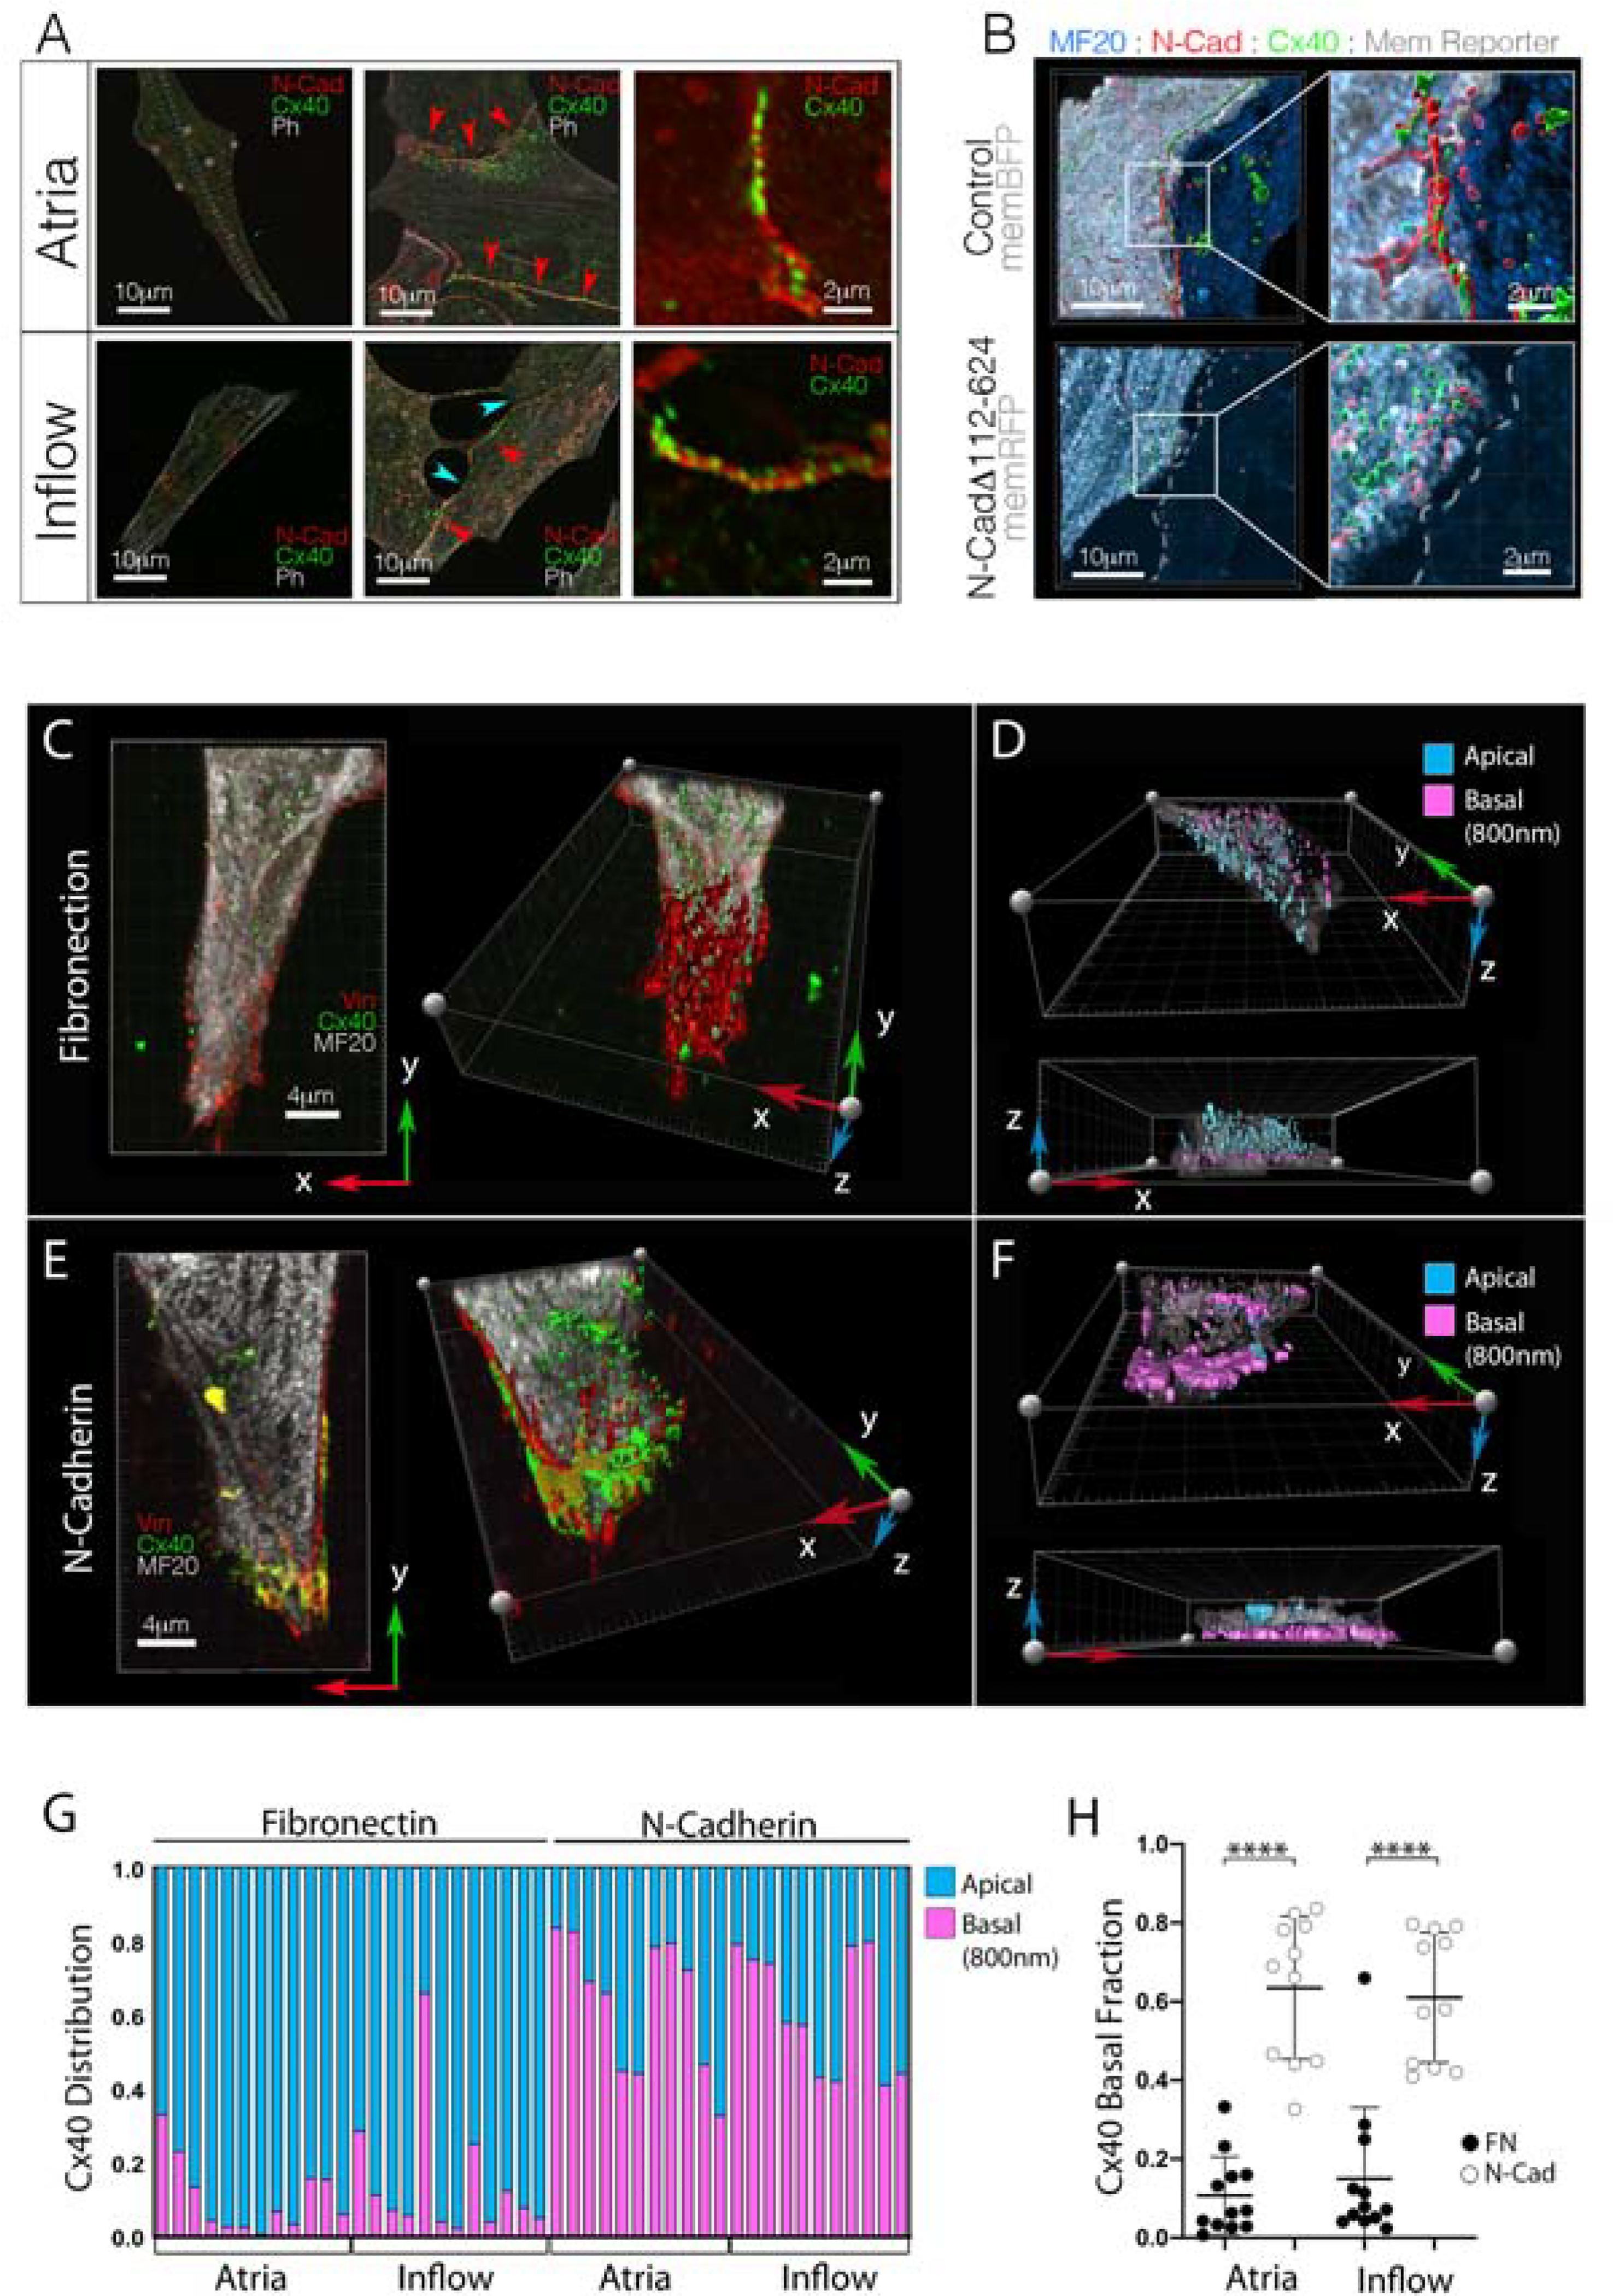
Figure 6. AJ and gap junction proteins colocalize within embryonic CPCs and atrial WM.

A) Cellular distribution of the AJ protein, N-Cad, and GJ protein, Cx40. Regardless of source tissue, isolated cells (no cell-cell contacts) show little N-Cad or Cx40 immunoreactivity. However, when cell junctions are present, both N-Cad and Cx40 traffic to the cell-cell interface (red arrowheads). Note: inflow cells form junctions in culture, but they tend to show disrupted morphology (blue arrowheads). Scale bars - as indicated in panels. B) Representative images of N-Cad (red) and Cx40 (green) distribution in control vs N-CadΔ112–624 overexpressing atrial WM cell pairs. Scale bars - as indicated in panels. C) Distribution of Vinculin (red) and Cx40 (green) in isolated inflow cell plated on Fibronectin. Cell is viewed from two angles: from above and a rotated view exposing the basal surface of the cell in contact with the fibronectin coating. Scale bars - 4μm D) Cell from “C,” color coded to indicate distance of Cx40 positive staining from the basal surface of the cell. E) as in “C,” for an inflow cell plated on a coverslip coated with N-Cadherin.. F) As in “D,” for the cell plated on N-Cad in “E.” G) Quantification of Cx40 distribution in cells cultured either on Fibronectin or N-Cadherin. Each column represents an individual cell and the proportion of Cx40 immunoreactivity detected within 800nm of the coverslip is indicated in pink. H) Change in Cx40 distribution based on substrate composition. Mean +/− SD are indicated by line and bars.
