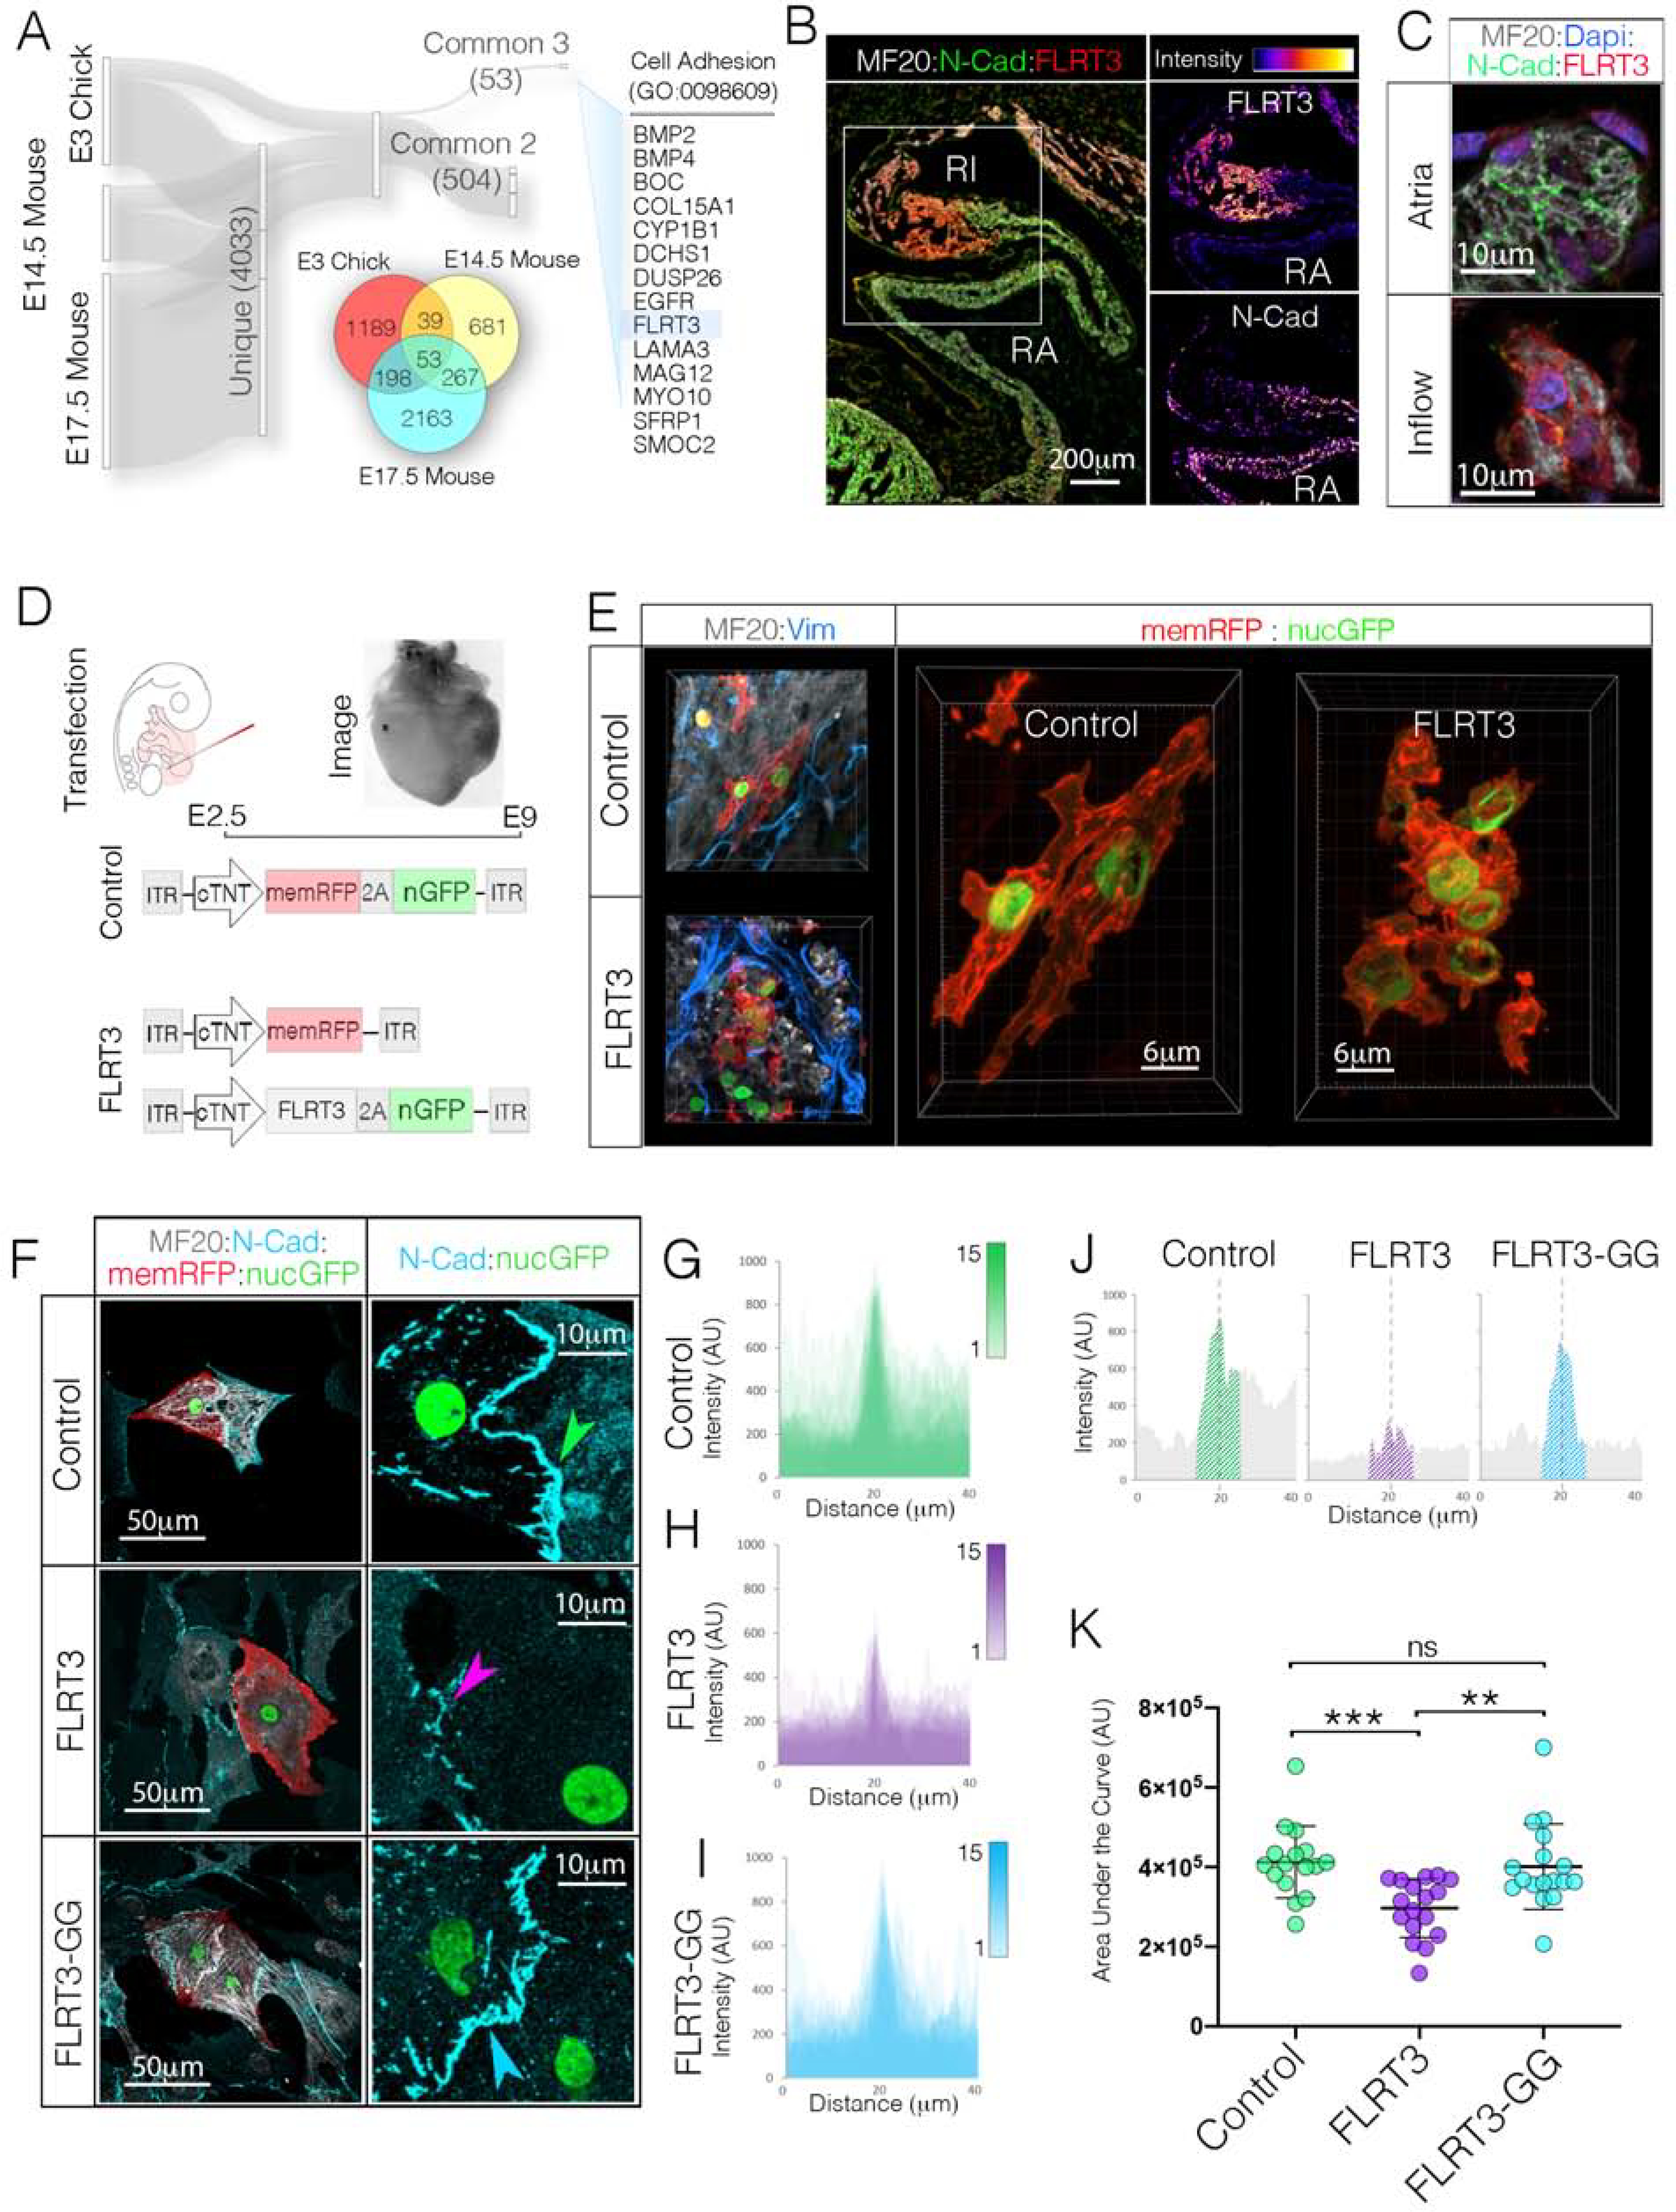
Figure 7. Negative Regulator of Cadherin Function, FLRT3, Disrupts CPC AJ Engagement.

A) RNAseq data sets from E3 Chick (GSE112894 (Bressan et al., 2018)), E14.5 Mouse (GSE65658 (Vedantham, 2015)), and E17.5 Mouse (GSE125932 (van Eif et al., 2019)) sinoatrial nodes were screened for common genes that displayed greater than 2-fold enrichment over atrial WM. The 53 genes common to all three data sets were then assessed for known biological functions related to cell adhesion. This analysis identified FLRT3 as a potential candidate regulator of CPC AJ formation. B) Immunohistochemical localization of FLRT3 and N-Cad. Single channel intensity plots demonstrate that the FLRT3 positive Inflow myocardium shows little immunoreactivity for N-Cad. Scale bar - 200μm C) Higher magnification imaging of FLRT3 and N-Cad immunostaining (see also Figures S7E, S7F). Scale bar – 10μm. D) Diagram for FLRT3 in vivo over expression approach. E) Immunostaining for MF20 (white) and Vimentin (blue) in Control and FLRT3 overexpressing hearts. Scale bar - 6 μm F) Comparison of control, FLRT3, and FLRT3-GG expression on AJ formation in vitro. Scale bars - as indicated in panels. G) Overlay of intensity profiles of N-Cad staining across 15 control cell pairs. Position of cell-cell contact (ex. green arrowhead in “F”) for each cell pair is superimposed at dotted line. H) As in “G,” for cell pairs FLRT3 (n=15). Position of cell-cell contact (ex. purple arrowhead in “F”) are superimposed at dotted line. I) As in “G” and “H” for cells expressing FRLT3-GG (n=15). J) Intensity profile of a single N-cad junctions from control, FLRT3, and FLRT3-GG cells from “F”. Hatched region indicates “area under the curve” quantified in “K.” K) Quantification of N-Cad staining at cell contacts. Mean +/− SD are indicated by line and bars.
