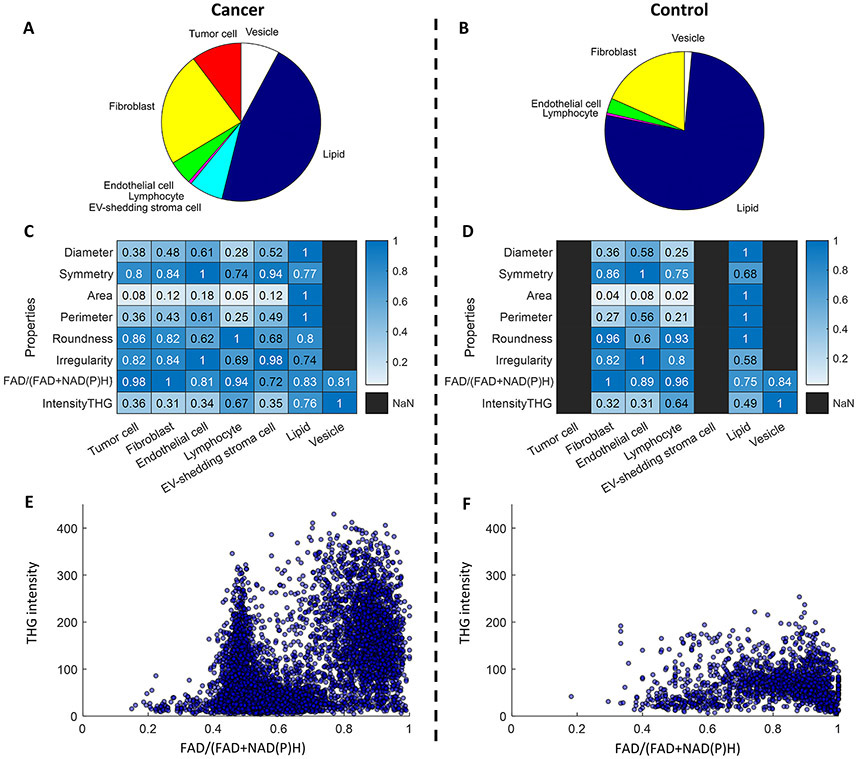
Figure 4. Analysis of EV and cell properties and distributions.
Component percentage of (A) cancer and (B) control tissue, which is computed using the area occupied by one cell type divided by the total positive areas of the multiclass mask. Heatmaps of cellular and EV properties of (C) cancer and (D) control tissue. Values are normalized per row to facilitate visualization and comparison. Scatterplots of the optical signatures of individual EVs in (E) cancer and (F) control tissue.

