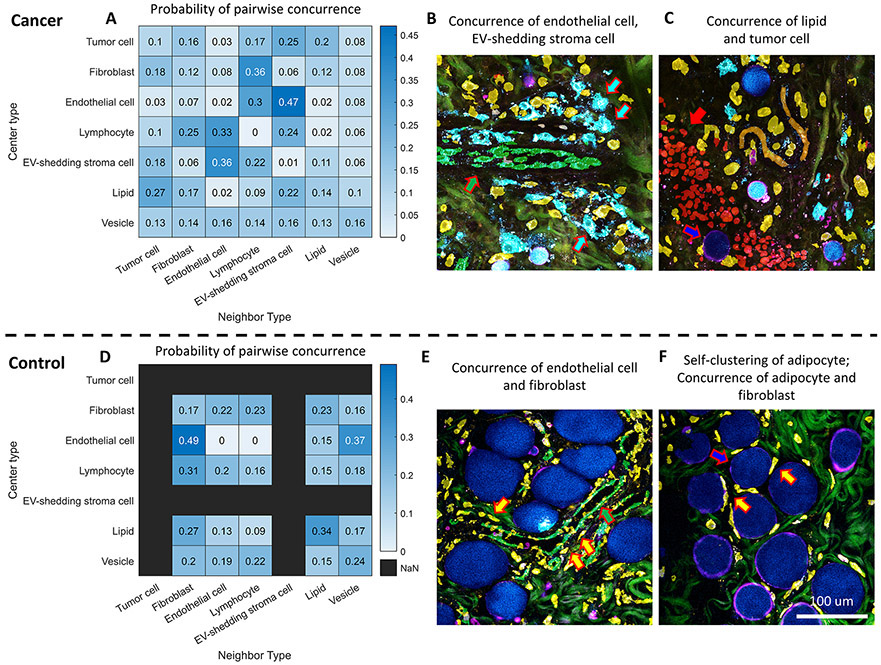
Figure 5. Concurrence mapping of different cell types and EVs in cancer and normal tissue.
(A) Concurrence heatmap for every pair of cell type and EV in cancer tissue. (B) A representative post-segmentation image of endothelial cells (overlaid with green masks and pointed with green arrows) in cancer tissue surrounded by NAD(P)H-rich EV-shedding stroma cells (overlaid with cyan masks and pointed with white arrows). (C) A representative post-segmentation image of adipocytes (blue mask and blue arrow) at the tumor boundary (red mask and red arrow). (D) Concurrence heatmap for every pair of cell type and EV in normal tissue. (E) A representative post-segmentation image of endothelial cells (green mask and green arrow) in normal tissue surrounded by fibroblasts (yellow mask and yellow arrow). (F) A representative post-segmentation image of adipocytes (blue mask and blue arrow) in normal tissue that features accumulation of large lipid droplets surrounded by fibroblasts (yellow mask and yellow arrow). The co-occurrence frequency between cell type AB is computed by counting the frequency of having cell type B as the nearest neighbor of cell type A, divided by the frequency of cell type B at the imaging site. Here in the heatmap, the frequency ratio was then normalized by the row to facilitate visualization and comparison. The raw frequency ratio is reported in Supplementary Figure S2.

