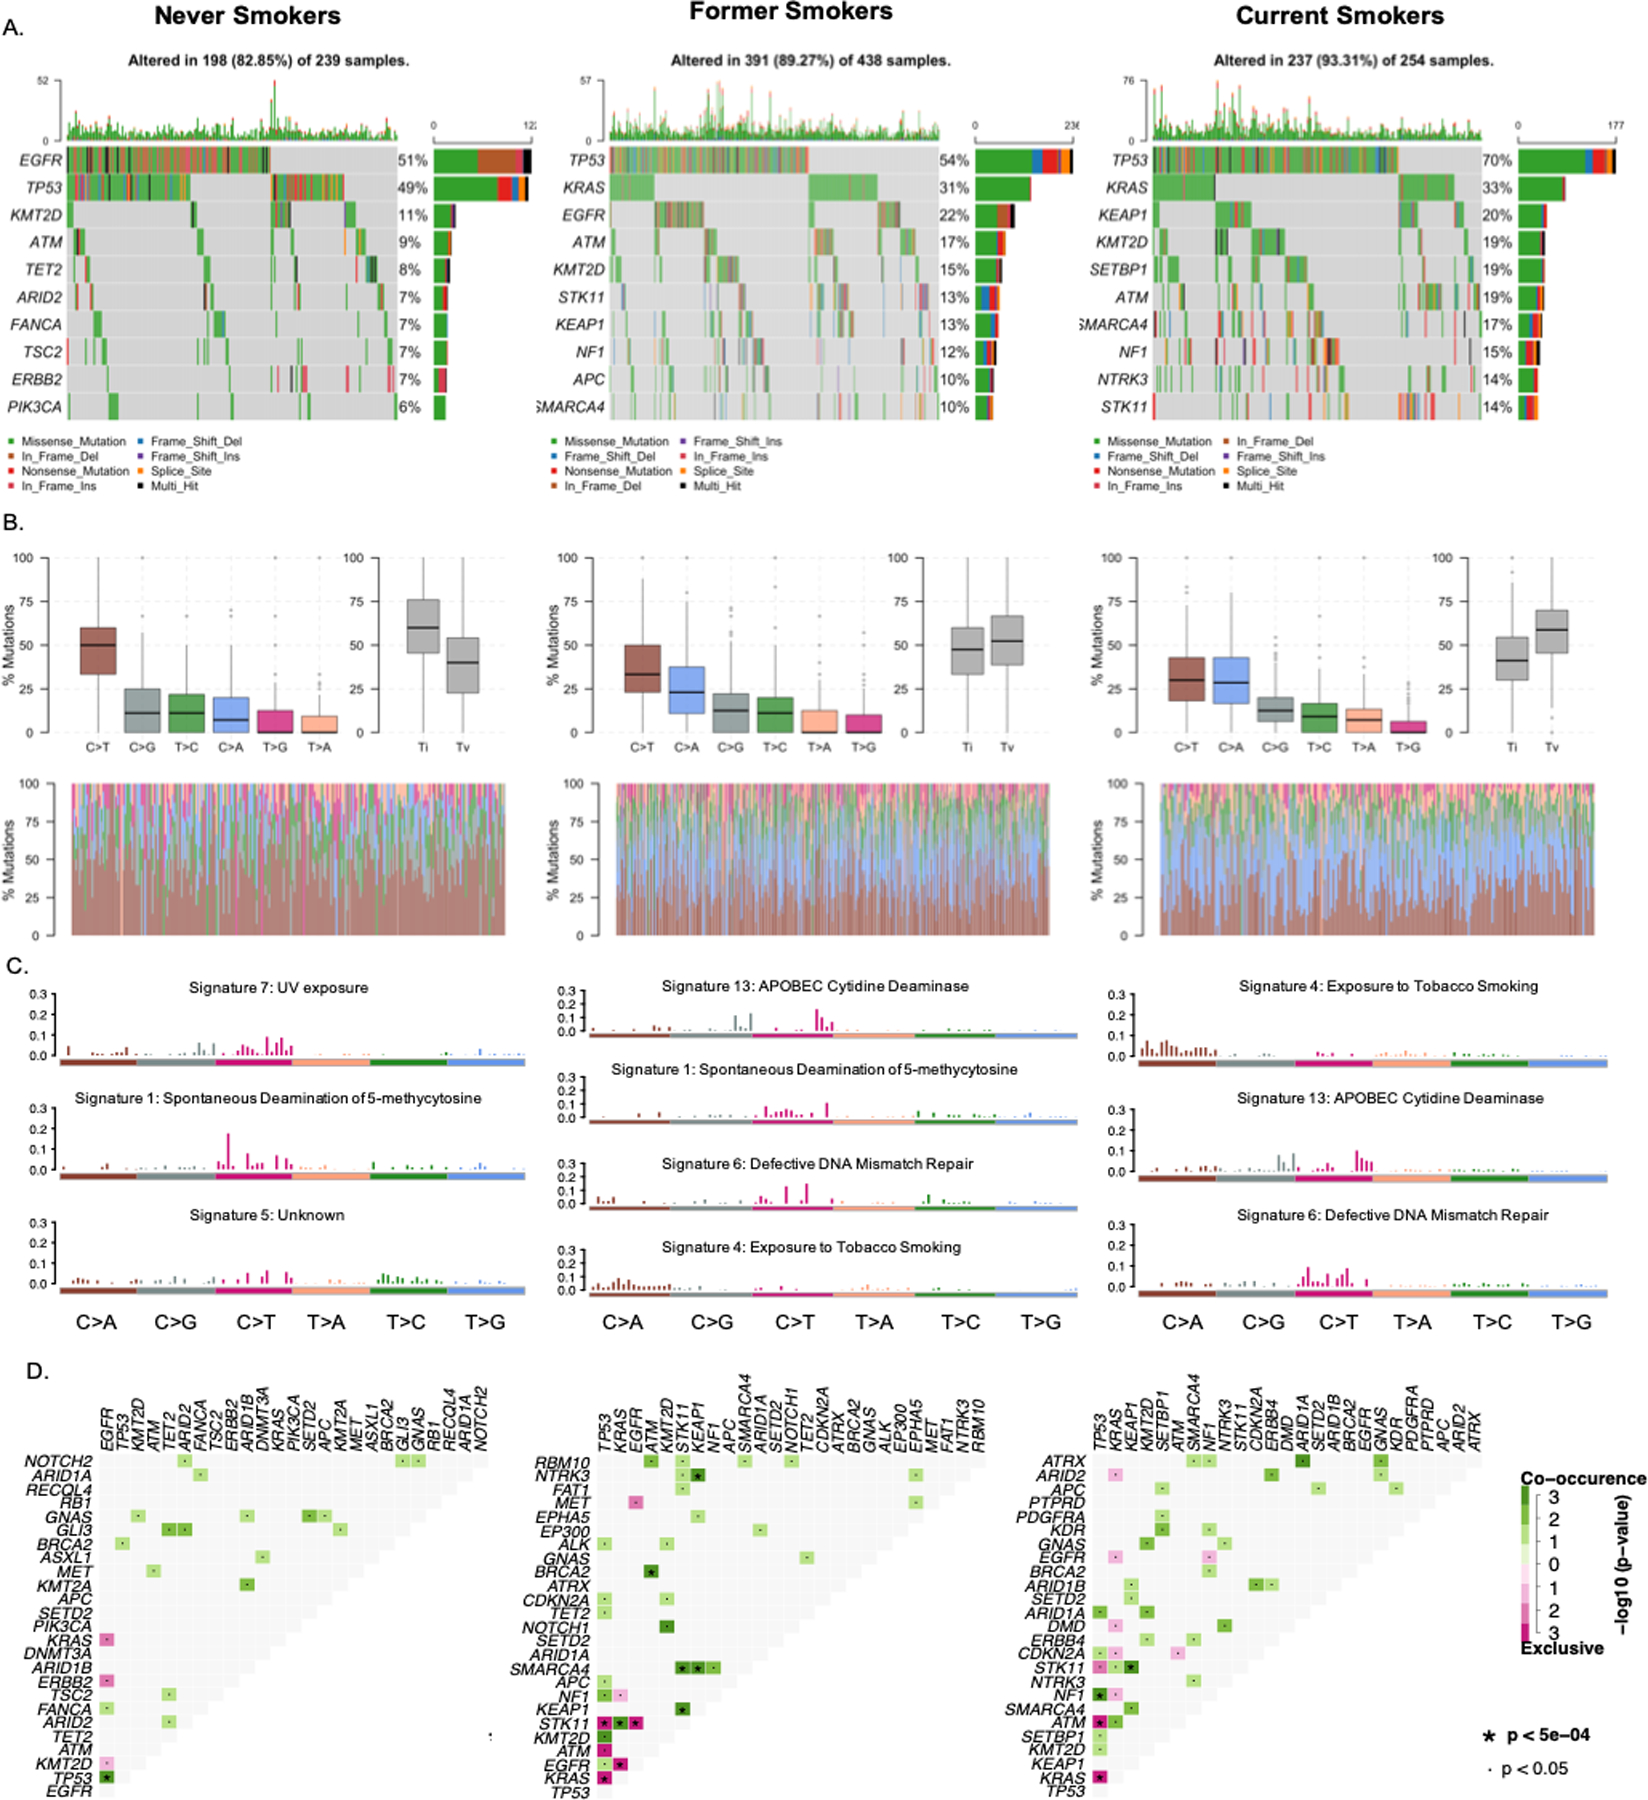
Figure 1. Mutation landscape in advanced NSCLC patients by smoking status.

Mutation landscape in advanced NSCLC patients by smoking status. A. Oncoplot of the top 10 mutated genes in each smoking group in our cohort. Each row represents a gene and each column represents a sample. Genes are ordered by mutation frequency and are differentially colored based on different mutation types. B. Transition and transversion plot displays distribution of Single Nucleotide Variants (SNV) classified into six transition and transversion events. Stacked bar plot (bottom) shows distribution of mutation spectra for every sample. C. Mutational signatures identified in each smoking subgroup. The y-axes indicate exposure of 96 trinucleotide motifs to the overall signature. Each plot title indicates the best match against validated Catalogue of Somatic Mutations in Cancer (COSMIC) signatures and cosine similarity value along with the proposed etiology. D. Mutually exclusive and co-occurring gene pairs are displayed as a triangular matrix. Green indicates tendency toward co-occurrence, whereas pink indicates tendency toward exclusiveness.
