
Figure 1. Spatial Pattern of Network Components.
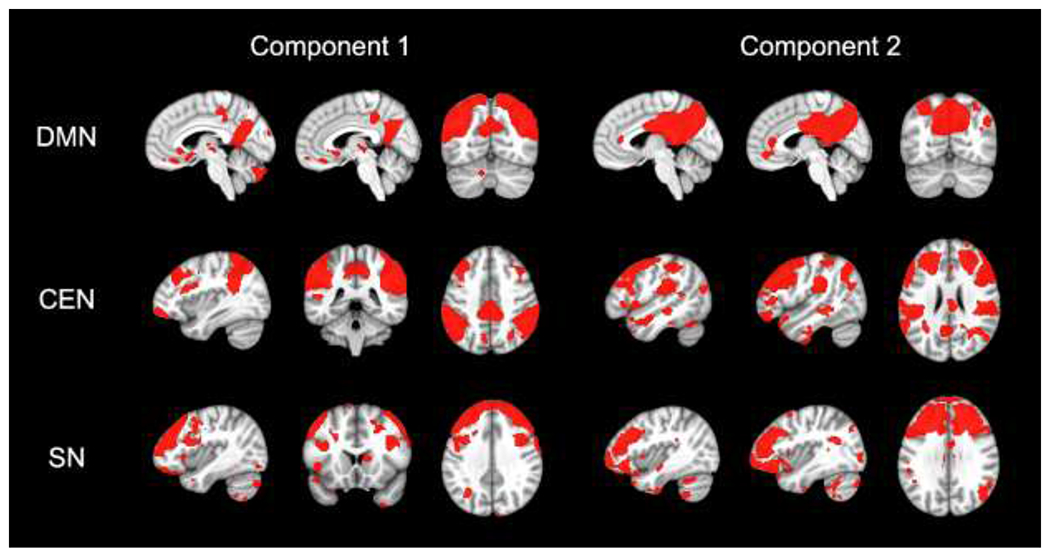
Note. Component maps illustrate the spatial distribution for the three networks of interest from the independent component analysis. The two components with the highest correlations with the DMN, CEN, and SN templates are shown. For visualization purposes, component maps were thresholded at p-uncorrected < .001 and z > 1. All component maps are displayed on the MNI-152 template. DMN = default mode network; CEN = central executive network; SN = salience network.