
Figure 2. Isolation of ARC by Lgals3 and CD36 and their impairment in adipogenic differentiation.
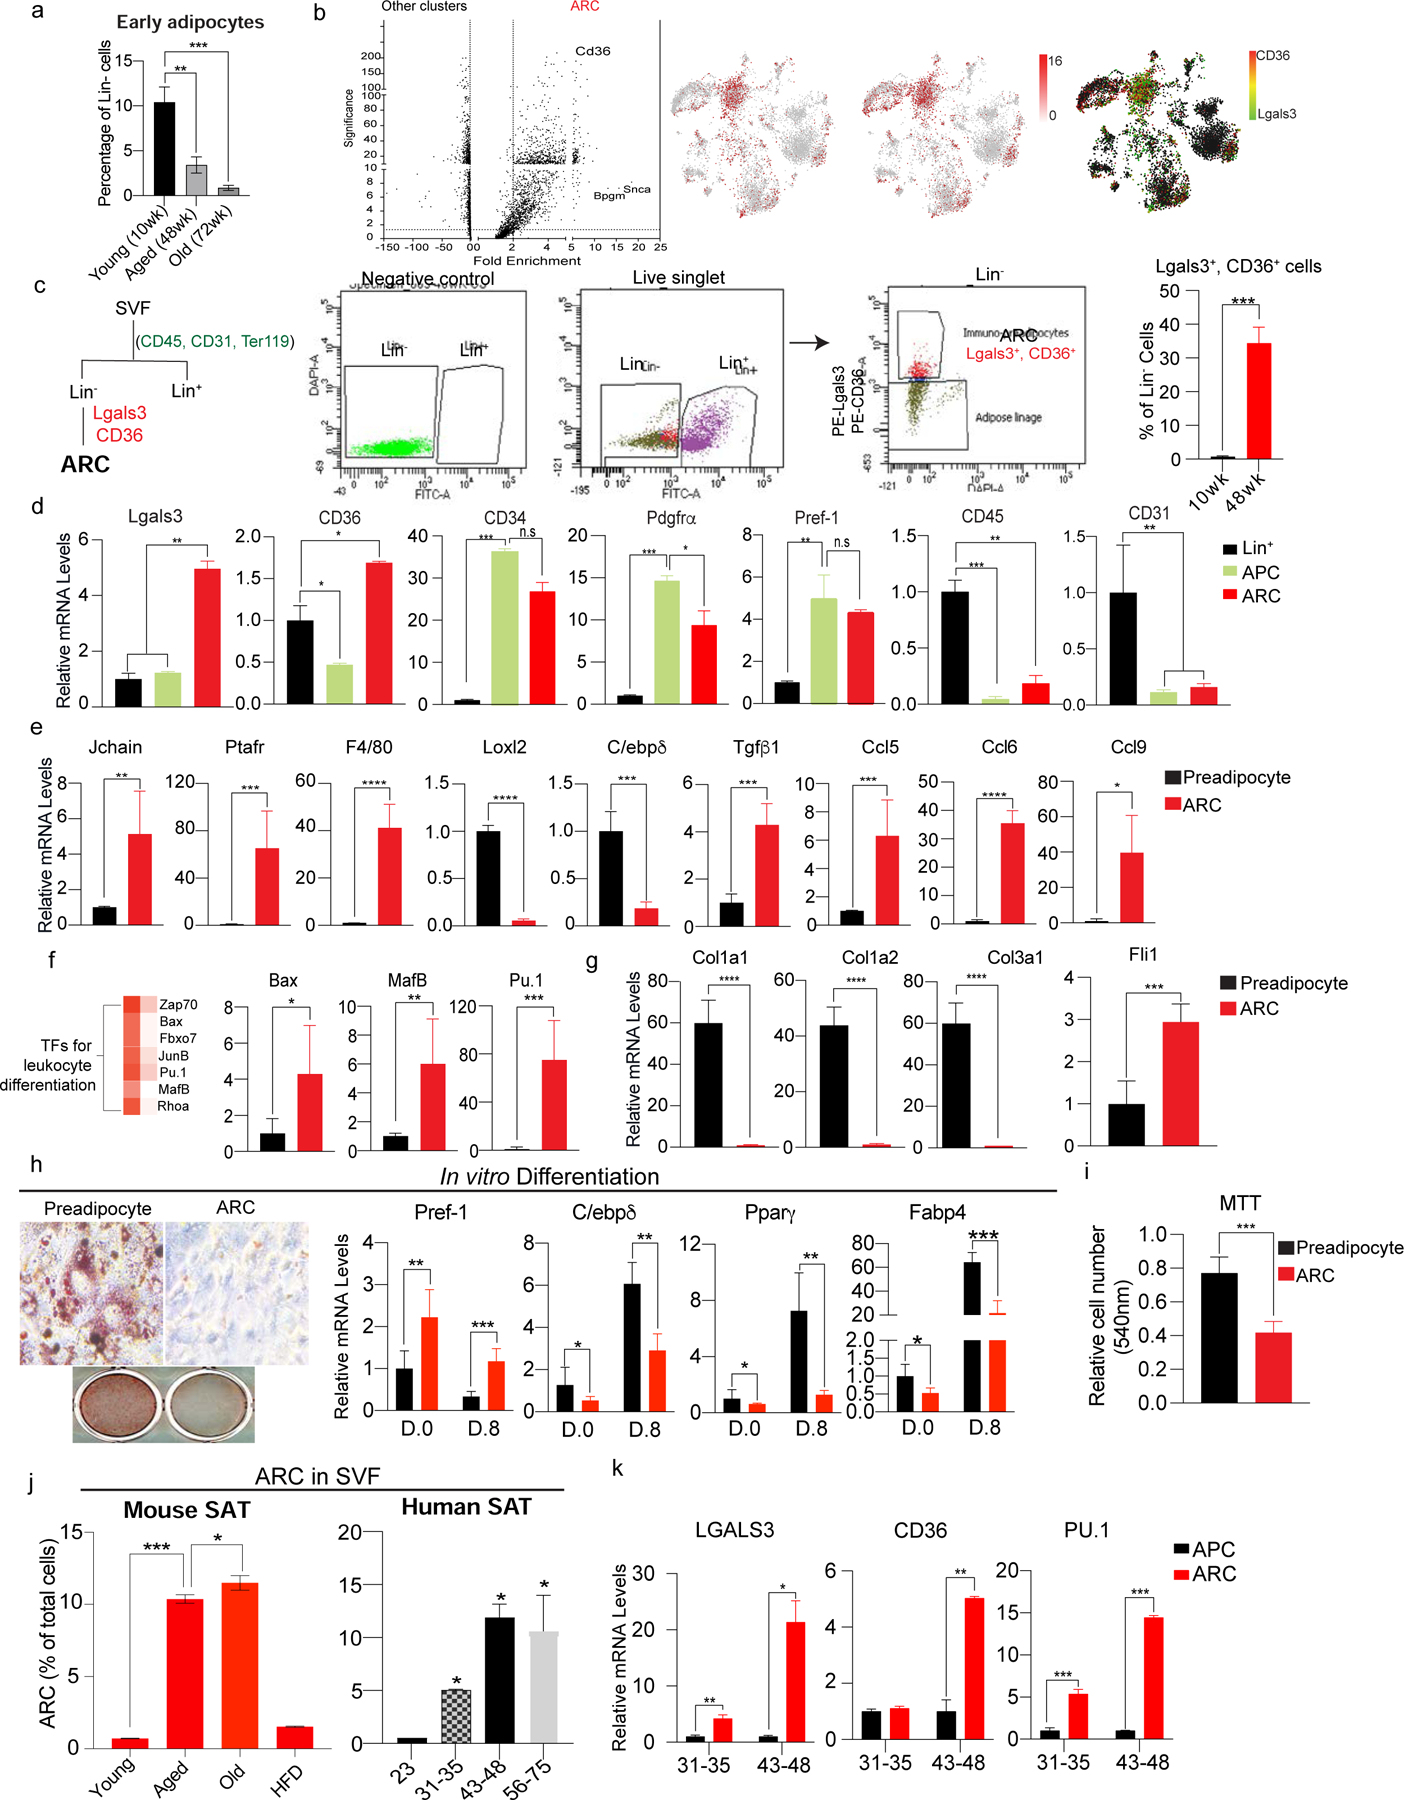
(a) FACS analysis for early adipocytes using FABP4 in iWAT of young (10wk), aged (48wk), and old (72wk) mice (n=6).
(b) (Left) Volcano plot of differential gene expression of ARC compared to other clusters in SVF of iWAT of aged mice. (Right) tSNE-plot showing co-localization of Lgals3 and CD36 in the ARC cluster.
(c) (Left) FACS gating strategy for isolation of ARC by FACS. ARC cells were isolated from Lin− cells with Lgals3 and CD36. (Right) Percentage of Lgals3+ and CD36+ cells in Lin− cells of iWAT of young and aged mice (n=6).
(d) RT-qPCR of FACS-sorted ARC, APC, and Lin+ cells. ARC markers: Lgals3 and CD36, adipose progenitor markers: CD34, Pdgfrα, and Pref-1, Immune cell marker: CD45, and endothelial cell marker: CD31 (n=4–6).
(e) RT-qPCR of FACS-sorted ARC and preadipocytes for genes involved in inflammation (Jchain, Prafr, and F4/80), regulation of adipocyte differentiation (Loxl2 and C/ebpδ), and chemokine production (Ccl5, Ccl6, Ccl9) (n=6).
(f) (Left) Heatmap of enriched transcription factors regulating leukocyte differentiation in ARC vs other clusters. (Right) RT-qPCR of FACS-isolated ARC and preadipocyte transcription factors, including Bax, MafB, and Pu.1.
(g) RT-qPCR of FACS-sorted ARC and preadipocyte for adhesion molecules, such as Col1a, Col2a, and Col3a1 and transcription factor, Fli1 (n=6).
(h) In vitro adipocyte differentiation of isolated preadipocytes using CD38 and ARC. (Left) Oil Red O staining, and (Right) RT-qPCR for Pref-1, C/ebpδ, Pparγ, and Fabp4 (n=8).
(i) MTT assay comparing cell numbers of cultured FACS-isolated preadipocytes and ARC (n=8).
(j) FACS analysis of the percentage of ARC in iWAT of young, aged, old, and HFD-fed mice (n=4).
(k) (Left) FACS analysis of the percentage of ARC in SAT of humans. (Right) RT-qPCR of LGALS3, CD36, and PU.1 (n=6).
Data are represented as mean ± S.D. *≤0.05, **≤0.01, ***≤0.001. See also Figure S2.