
Figure 4. The Role of Pu.1 in generation and function of ARC.
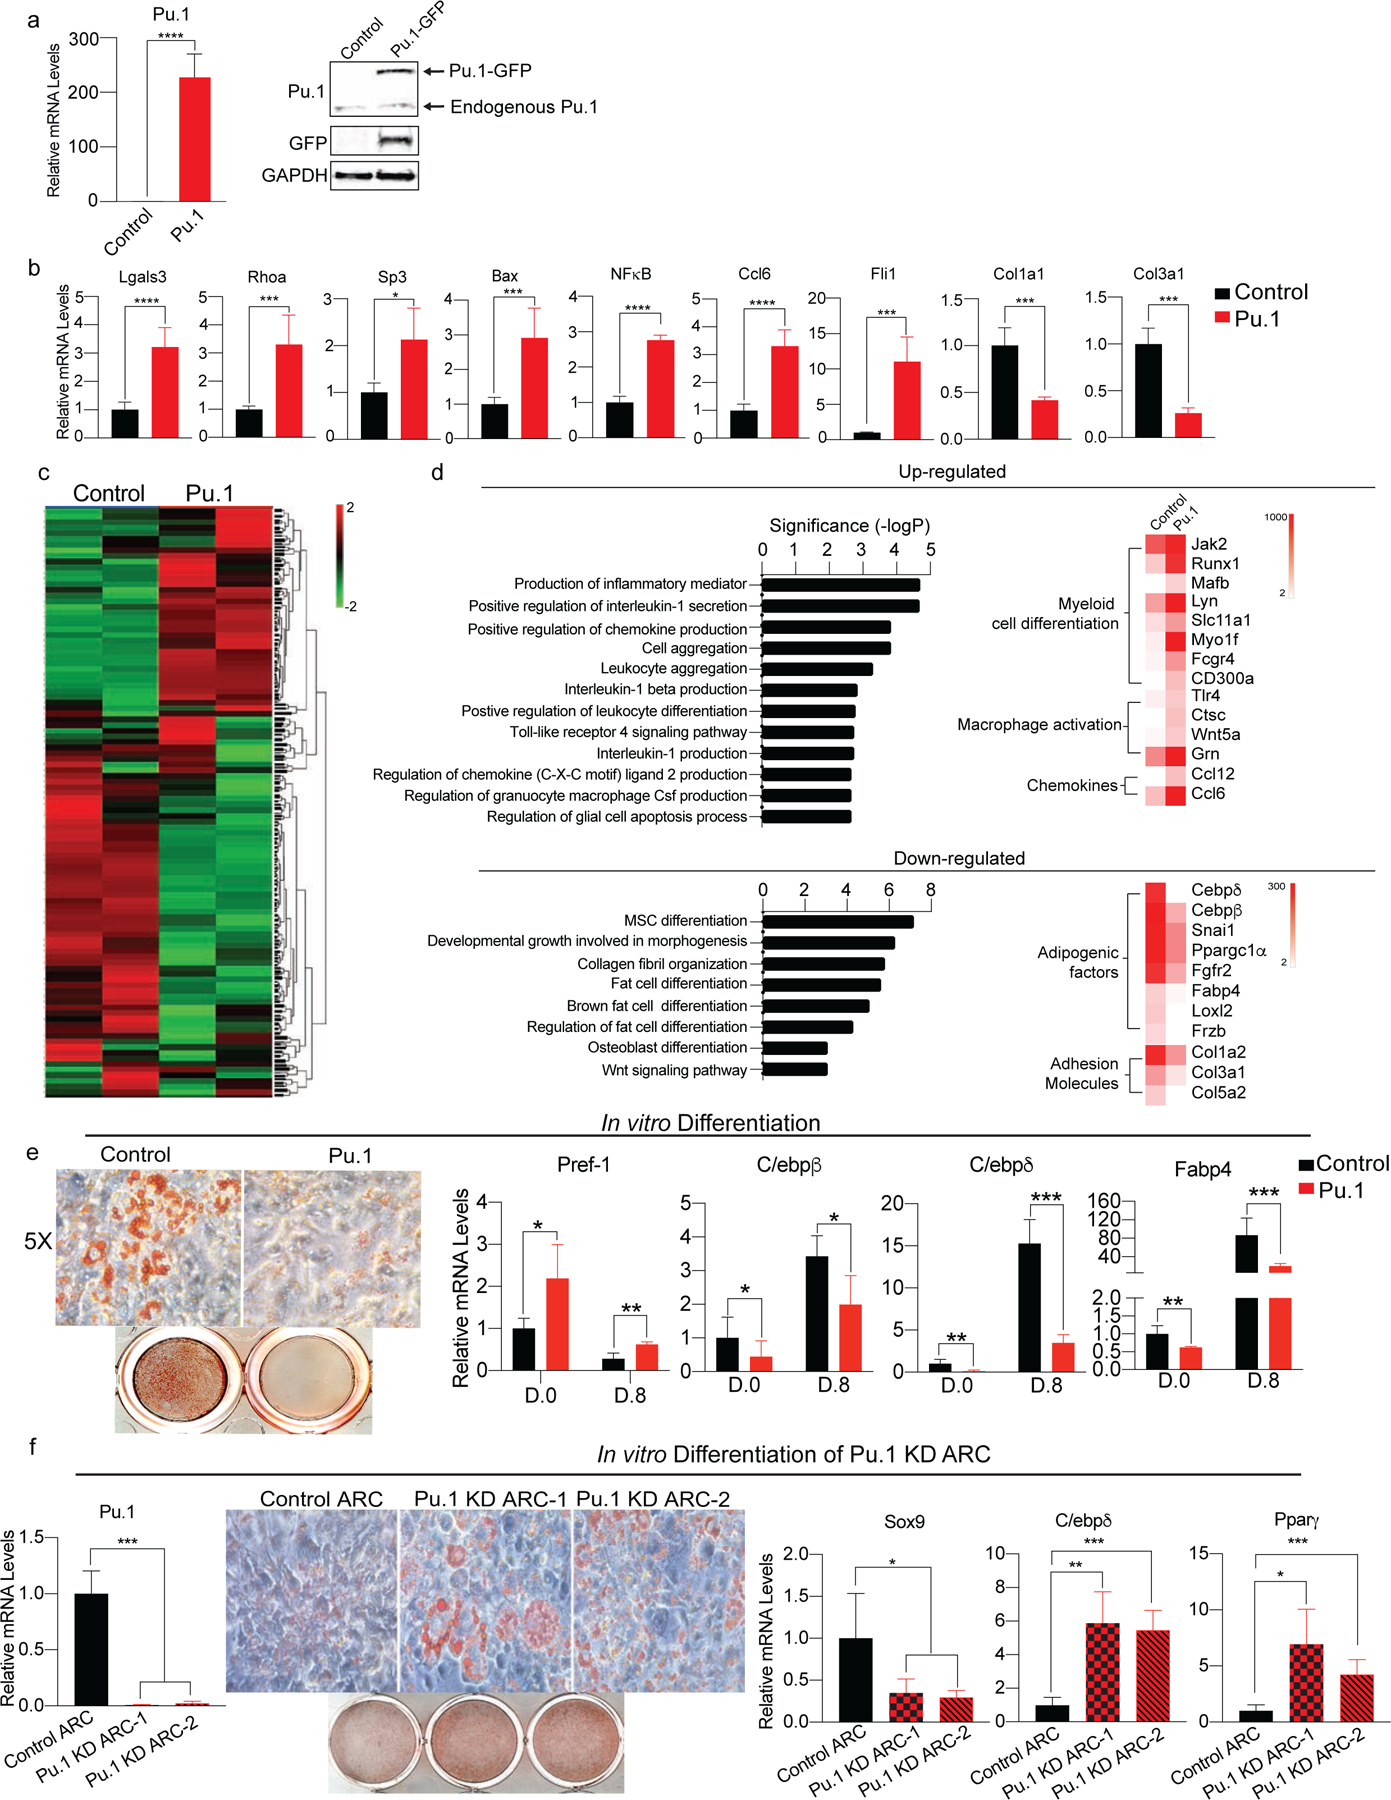
(a) Pu.1 was overexpressed in 3T3-L1 cells. (Left) RT-qPCR for Pu.1, (Right) immunoblotting for Pu.1 and GFP (n=6–8).
(b) RT-qPCR for genes enriched in ARC such as Lgals3, Rhoa, Sp3, Bax, NFκB1, Ccl2, Ccl5, and Fli1 as well as collagen genes decreased in ARC such as Col1a1, Col1a2, and Col3a1 (n=6).
(c) RNA-seq of Pu.1 overexpressing 3T3-L1 cells. Heatmap of global gene expression profile (n=3).
(d) (Top) Upregulated pathways and representative genes. (Bottom) Downregulated pathways and representative genes.
(e) In vitro adipocyte differentiation of Pu.1 overexpressing 3T3-L1 cells. (Left) Oil Red O staining, (Right) RT-qPCR for Pref-1, C/ebpβ, C/ebpδ, and Fabp4 (n=6).
(f) In vitro adipocyte differentiation of Pu.1 KD ARC. (Left) RT-qPCR for Pu.1 in control ARC and Pu.1 KD ARC. (Right) Oil Red O staining and RT-qPCR for Sox9, C/ebpδ, and Pparγ (n=4–8).
Data are represented as mean ± S.D. *≤0.05, **≤0.01, ***≤0.001. See also figure S4.