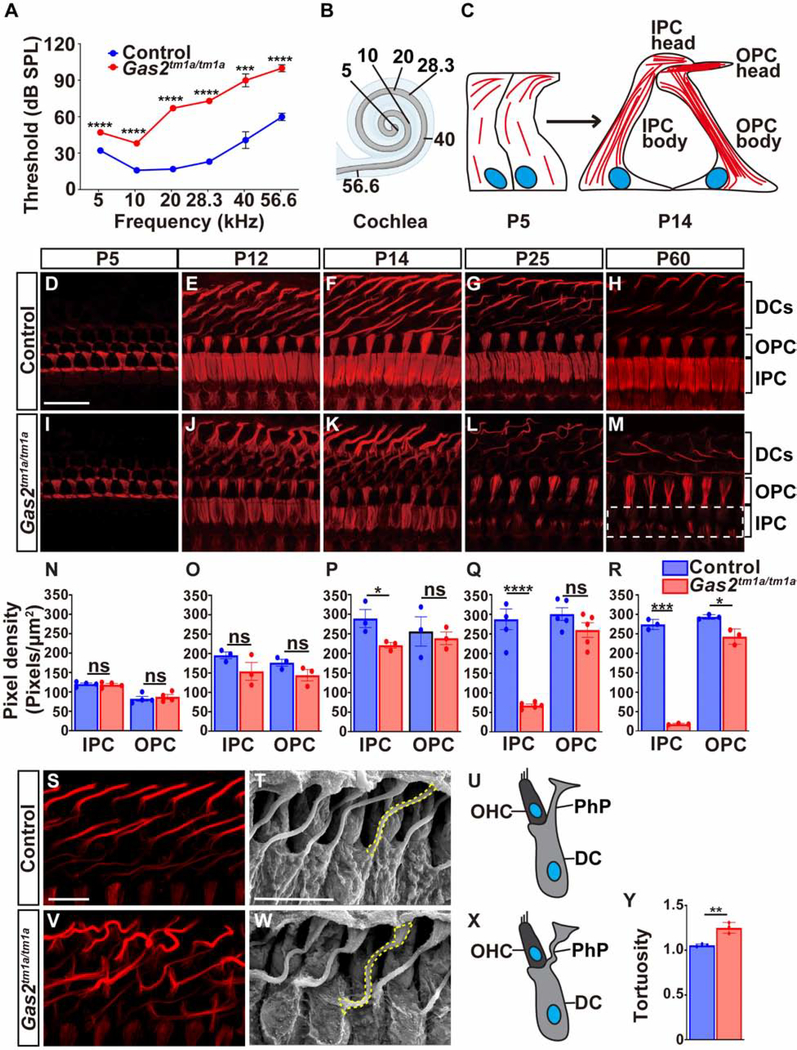
Figure 2. Gas2tm1a/tm1a mice display hearing loss and defects in supporting cell microtubules.
(A) ABR thresholds are elevated in Gas2tm1a/tm1a (n=6) compared to control (n=5) mice at P56 (***p<0.001, ****p<0.0001, multiple T-test with Holm-Sidak method). (B) Schematic representation of the tonotopic organization of the cochlear duct. (C) Illustration of microtubule bundle assembly at apical (head) and longitudinal (body) positions of inner and outer pillar cells. Microtubules are drawn in red and the nucleus in blue. (D-M) Time course analysis of dTyr α-tubulin immunostaining on whole mount cochlear preparations from control and Gas2tm1a/tm1a mutants. The heads of inner pillar cells show a progressive destabilization of microtubule bundles that are almost completely absent at P60 (dotted white box). (N-R) Quantification of dTyr α-tubulin pixel density in pillar cells from control and Gas2tm1a/tm1a mice presented as mean ±SEM (*p<0.05, ****p<0.0001, two-tailed t-test, six cells were analyzed per mouse, from a minimum of three mice, ns: not significant). (S,V) Whole mount dTyr α-tubulin immunostaining of cochlear preparations from control and Gas2tm1a/tm1a mice at P25 showing microtubule disorganization in Deiters’ cell phalangeal processes. SEM images (T,W) and schematic illustrations (U,X) of Deiters’ cells from control and Gas2tm1a/tm1a mice at P25 showing increased tortuosity of phalangeal processes (yellow dashed line) quantified in (Y) (**p<0.01, two-tailed t-test; four cells were analyzed per sample, n=3, error bars represent SEM). Scale bar = 20 μm (D), 10 μm (S), 10 μm (T). Abbreviations: Deiters’ cell (DC), inner pillar cell (IPC), outer pillar cell (OPC), outer hair cell (OHC), phalangeal process (PhP).

