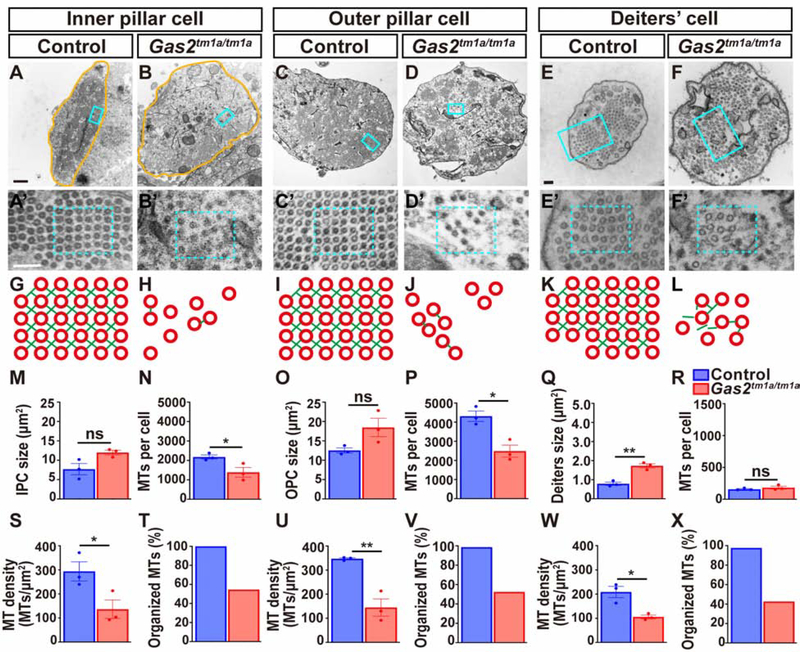
Figure 3. Cytoskeletal ultrastucture is dependent on GAS2.
(A-F) Transmission electron micrographs through the body of inner and outer pillar cells, and a Deiters’ cell phalangeal process from control and Gas2tm1a/tm1a mice at P25.
(A’- F’) Enlargement of boxed areas from A-F. (G-L) Schematic illustration of cytoskeletal organization corresponding to boxed regions in A’-F’. Note the disorganization and destabilization of microtubule arrays and disruption of actin (green) and microtubule (red) cross-links in Gas2tm1a/tm1a mice. (M-X) Quantification of cell size, microtubule number, density and organization in pillar and Deiters’ cells presented as mean ± SEM. (*p<0.05, **p<0.01, two-tailed t-test, three cells were analyzed per sample, n=3 samples, ns: not significant). Scale bars = 500nm (A), 100nm (A’, E, E’).

