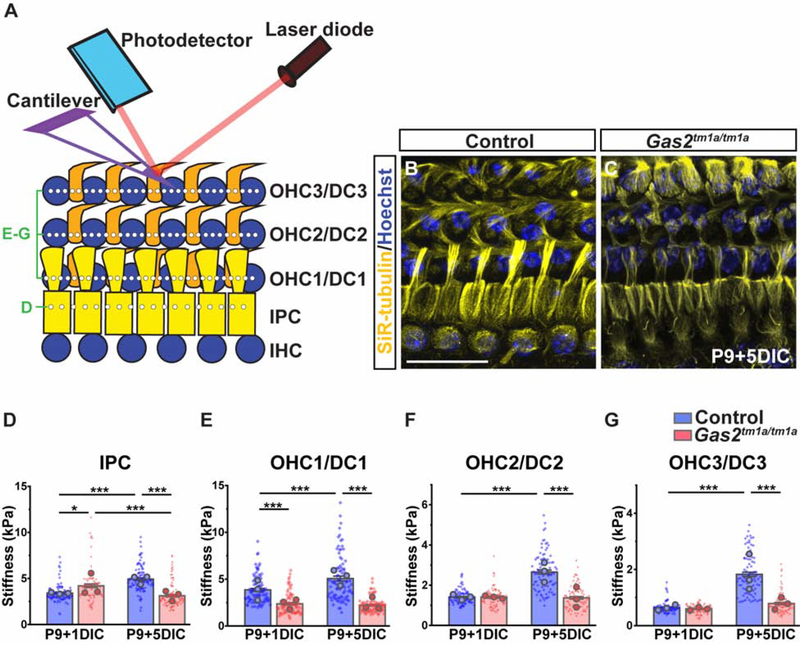
Figure 4. Supporting cells are less stiff in the absence of GAS2.
(A) Illustration of experimental approach for measuring supporting cell mechanical properties by AFM. (B, C) Cochlear explants isolated from Gas2tm1a/tm1a mice at P9 and grown for 5 days in culture (DIC) recapitulate supporting cell microtubule defects when compared to control mice as indicated by SiR tubulin (yellow) and Hoechst (blue) staining. Scale bar = 20μm (D-G) Quantification of stiffness in pillar cells (D) and individual OHC/Deiters’ cell (DC) rows (E-G). The data are presented as mean ±SEM of 30 measurements (diamonds) at 2μm increments along each cell row, which was repeated for all rows in three independent cochlear samples (mean for each cochlea is shown as large circle) (*p<10−3, ***p<10−6, two-way ANOVA on cellular measurements with post hoc Bonferroni comparison, factors of genotype and DIC).

