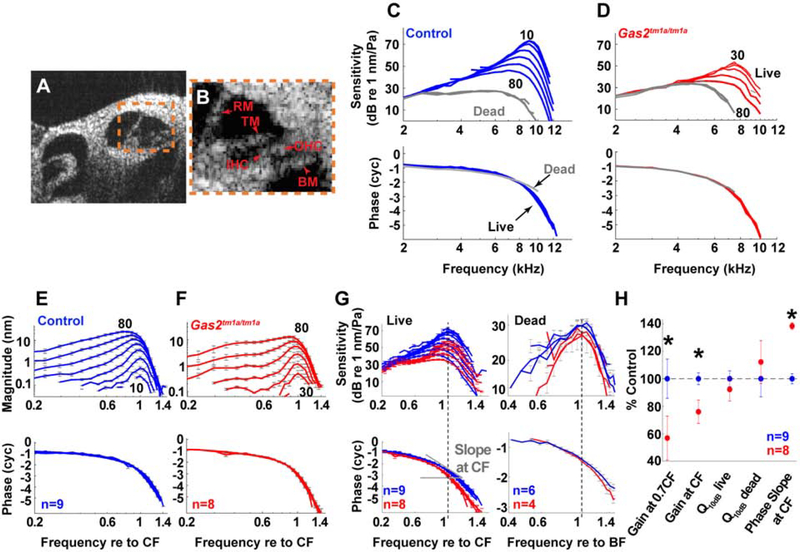
Figure 6. Vibratory responses to sound are impaired in live Gas2tm1a/tm1a mice.
(A) Cross-sectional image of the apical cochlear duct of a mouse obtained with VOCTV. (B) Enlargement of organ of Corti (boxed region in A); BM, basilar membrane; IHC, inner hair cell; OHC, outer hair cell; RM, Reissner’s membrane; TM, tectorial membrane. (C-D) BM sensitivity and phase for one control (blue) and one Gas2tm1a/tm1a (red) mouse. The numbers indicate the highest and lowest stimulus intensities that produced measurable vibratory responses. Postmortem data (60–80 dB SPL) are in gray. (E-F) Average displacements and phases of the BM motions for control (n=9) and Gas2tm1a/tm1a (n=8) mice. Frequencies are normalized to the CF of each individual mouse and error bars indicate the SEM. (G) The averaged vibratory sensitivity and phases of BM motion for live and dead mice are compared in control (blue) and Gas2tm1a/tm1a (red) mice. The frequencies are normalized to the corresponding CF and best frequency (BF) for live and dead data, respectively. Data from live mice show that Gas2tm1a/tm1a mutants have less amplification near CF and sharper phase change with increasing frequency. Data from dead mice (80 dB SPL) also show sharper phase change for Gas2tm1a/tm1a mutants. (H) Mean values of sensitivity change from 40 to 80 dB SPL at 0.7CF, CF, and Q10dB for live (40 dB SPL stimuli) and dead (80 dB SPL stimuli) mice, and phase slope (for 40 dB SPL at the CF) as a percentage of the appropriate control mean. Asterisks denote p<0.05.

