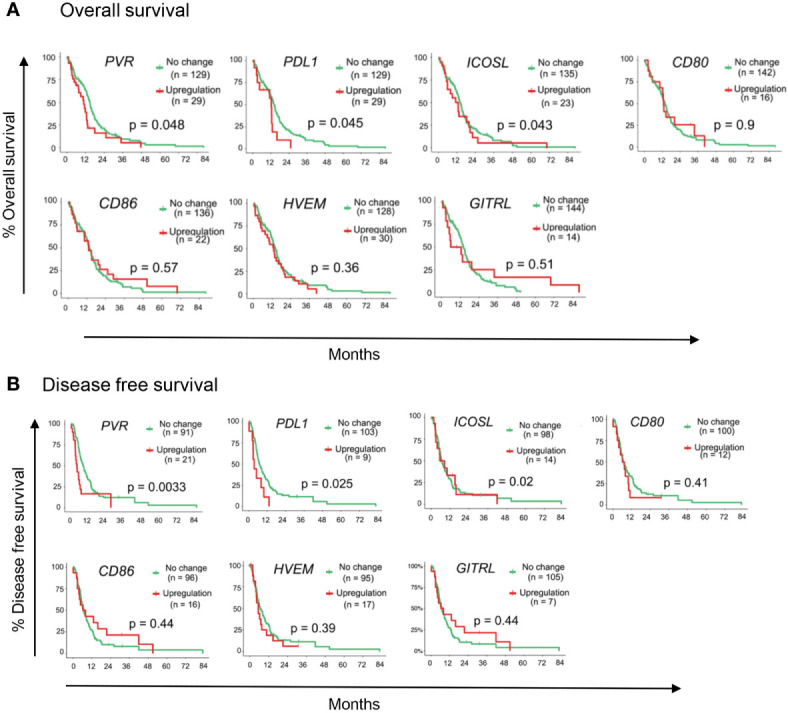
Figure 2.

Immune-checkpoint ligand genes associated with GBM patient outcome. TCGA patient survival data obtained from cBioPortal, and patients were grouped based on gene expression z-scores to upregulated expression (z ≥2; red line) or no change expression (z <2; green line). The (A) overall survival rate, and (B) disease free survival rates were plotted using Kaplan-Meier survival curves. P values reflect one-way ANOVA with Kruskal Wallis comparison test. n=153.
