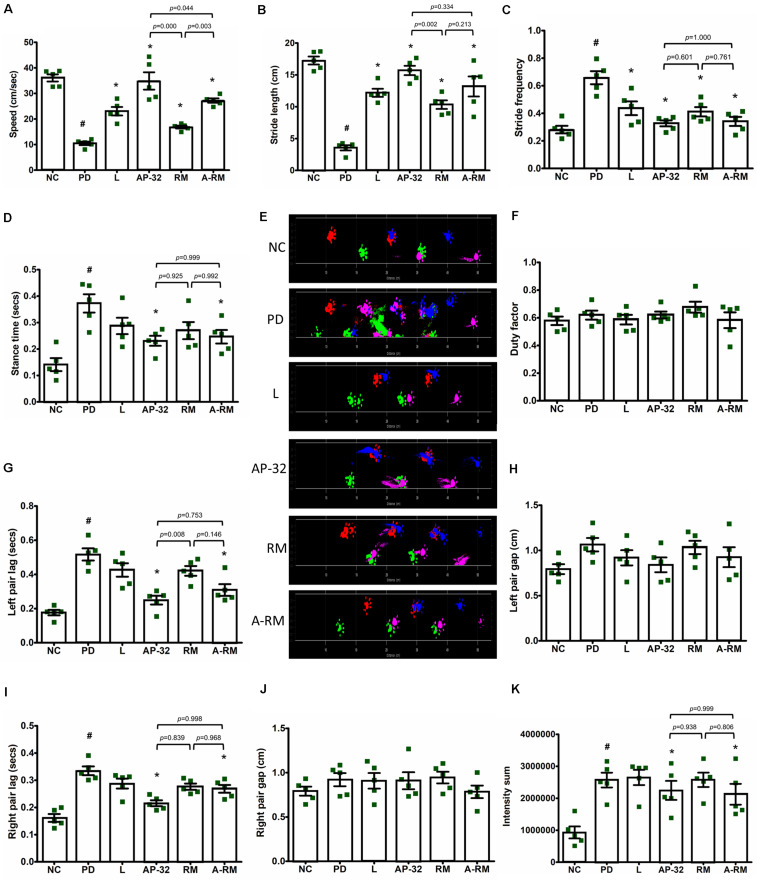
FIGURE 3.
Dynamic parameters for gait analysis in 6-OHDA-induced PD rats. (A) Speed started from entering until leaving the walkway. (B) Stride length. (C) Stride frequency. (D) Stance time. (E) Section from original footprints recorded after 8-weeks supplementations; pink, front left; blue, front right; green, hind left; red, hind right. (F) Duty factor. (G) Left pair lag. (H) Left pair gap. (I) Right pair lag. (J) Right pair gap. (K) Intensity sum. All data are expressed as mean ± SEM (n = 5 rats/group). #p < 0.05 PD group compared to NC group. *p < 0.05 L, AP-32, RM, and A-RM groups compared to PD group. Data were evaluated by one-way ANOVA with Tukey’s post hoc test.

