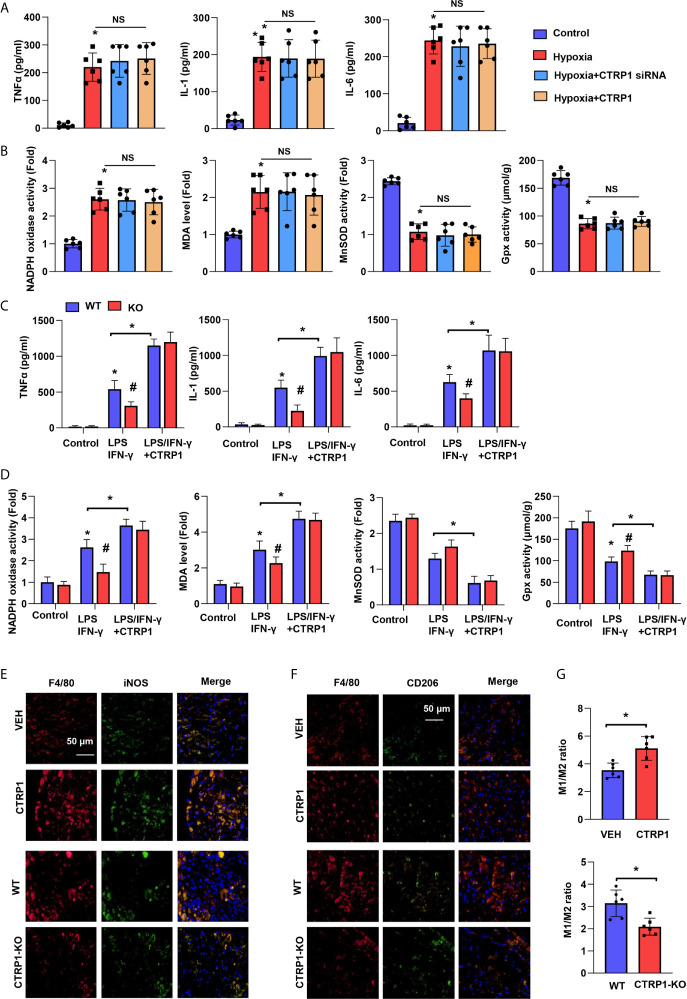
Figure 6.
Macrophages account for the effect of CTRP1 on cardiomyocytes. (A) Inflammatory cytokine levels in NRCMs transfected with CTRP1 siRNA or the human recombinant CTRP1 protein under hypoxia (24 h). (B) Oxidase and anti-oxidase activities and MDA levels in NRCMs in the indicated groups. *P<0.05 vs. the control group. (C) Primary bone marrow-derived macrophages isolated from CTRP-/- mice treated with LPS/IFN-γ and the CTRP1 protein for 24 h. Inflammatory cytokine levels in the indicated groups. (D) NRCMs were cultured with the macrophage supernatants in the indicated groups. Oxidase and anti-oxidase activities and MDA levels in NRCMs. *P<0.05 vs. the WT control group. # P<0.05 vs. the WT-LPS+IFN-γ group. All the in vitro experiments were repeated 3 times. NS, not significant. (E) Representative image of immunofluorescence staining for F4/80 and NOS2, or F4/80 and CD206 in CTRP1-KO mice post MI. (F) Representative image of immunofluorescence staining for F4/80 and NOS2, or F4/80 and CD206 in CTRP1 injected mice post MI. (G) Quantification result of F/480+/NOS2+ to F/480+/CD206+macrophage ratio in the indicated group (n=6). *P<0.05 vs. the WT/VEH group.

