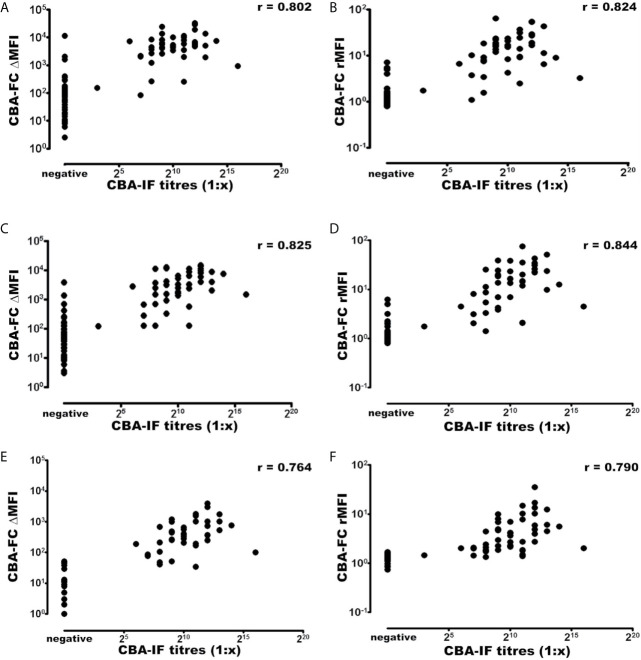
Figure 3.
Correlation of MOG-IgG titers and MFI values determined by CBA-IF and CBA-FC assays. The analysis were generated using CBA-IF and (A) CBA-FC1, (B) CBA-FC2, (C) CBA-FC3, (D) CBA-FC4, (E) CBA-FC5, and (F) CBA-FC6. The graphs are expressed as logarithmic scale, and the correlation values were calculated using the non-parametric Spearman correlation and correlation coefficient (r) are shown in the graph.

