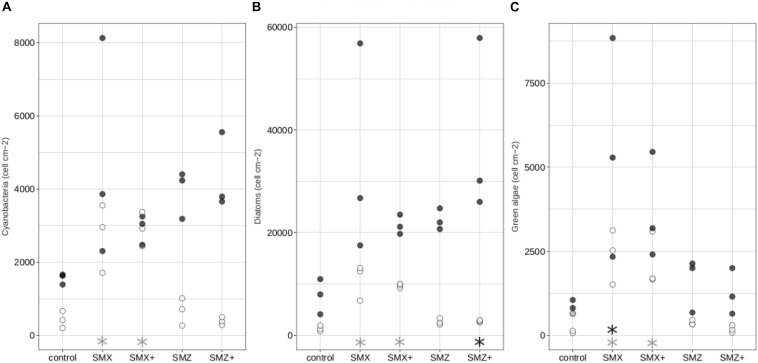
FIGURE 2.
Composition of the autotrophic community: density in cells cm–2 of cyanobacteria (A), diatoms (B), green algae (C) in the control biofilms and biofilms exposed to sulfonamides. White circles correspond to biofilms exposed for 14 days while black circles correspond to biofilms exposed for 28 days. Significant differences (p < 0.05) between controls and biofilms exposed to antibiotics are indicated by gray stars after 14 days of exposure and by black stars after 28 days of exposure.

