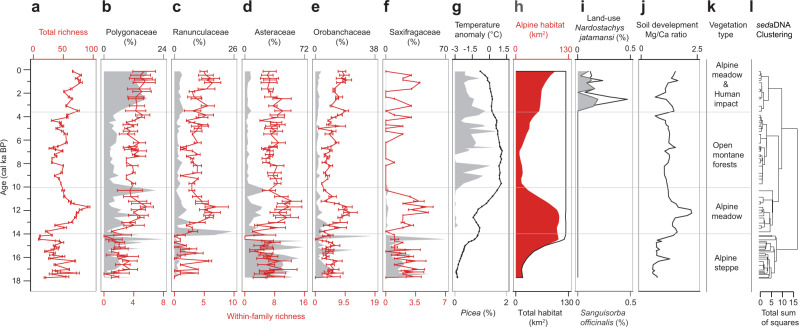
Fig. 2. Long-term history of plant sedaDNA recorded in Lake Naleng compared with time-series data.
a Total plant richness (red line; n = 138 PCR replicates of 71 lake-sediments, bars indicate 95% confidence intervals). b–f Comparison of sedimentary ancient DNA abundance (in %, grey polygon) of the most common alpine plant families with corresponding within-family plant richness (red line; n = 138 PCR replicates of 71 lake-sediments, bars indicate 95% confidence intervals) for Polygonaceae, Ranunculaceae, Asteraceae, Orobanchaceae, and Saxifragaceae. g The Northern Hemisphere (30°–90°N) temperature anomaly record since last deglaciation based on multiple proxies57,58 (black line with points, Methods) and percentage of Picea sedaDNA (grey polygon). h Alpine habitat area (red polygon) within the Lake Naleng catchment is the sum of pixels above the treeline (4400 m a.s.l.) based on simulated total habitat area (black outline, Methods). i sedaDNA indicators of traditional land-use including Sanguisorba officinalis (grey polygon) and Nardostachys jatamansi (black line). j The Mg/Ca ratio of Lake Naleng indicates the soil development within the lake catchment29. k vegetation types inferred from the pollen record19,20 and sedaDNA record. l Zonation (horizonal grey lines) according to a stratigraphically constrained cluster analysis (CONISS) based on relative read abundance. Data are presented as mean ± 95% confidence interval (error bars) in a–f. Source data are provided with this paper.

