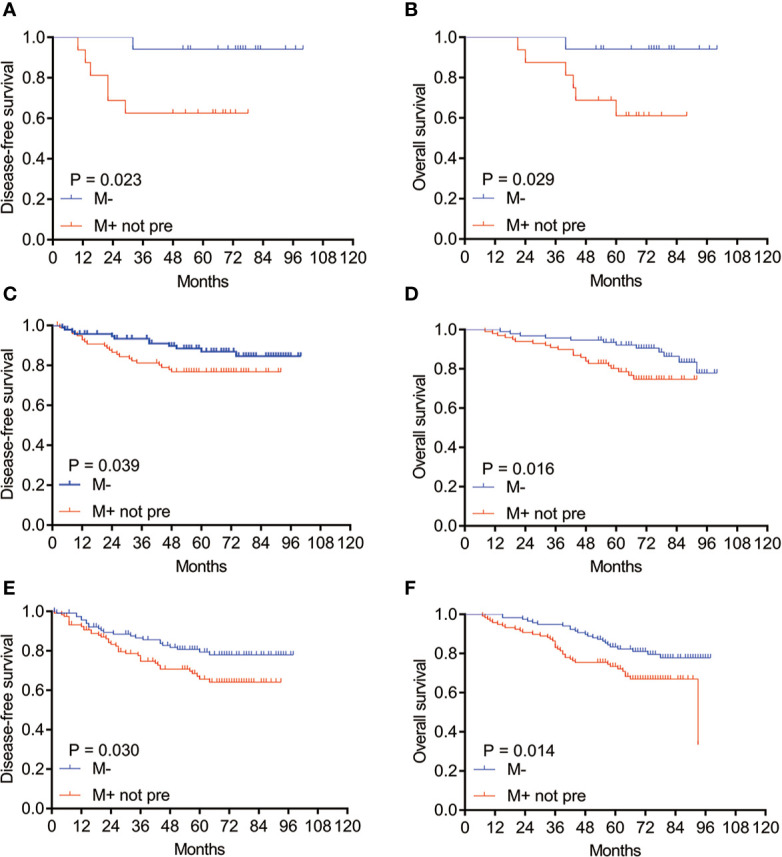
Figure 2.

Kaplan–Meier survival curves of DFS and OS for patients with M− and M+ not pre subtypes in different tumor sizes after PSM. (A) DFS and (B) OS for patients with M− and M+ not pre subtype in tumor size ≤1 cm; (C) DFS and (D) OS in tumor size >1 cm, ≤2 cm; (E) DFS and (F) OS in tumor size >2 cm, ≤3 cm. M−: without micropapillary pattern; M+ not pre: micropapillary pattern ≥5%, but not predominant; PSM, propensity score matching.
