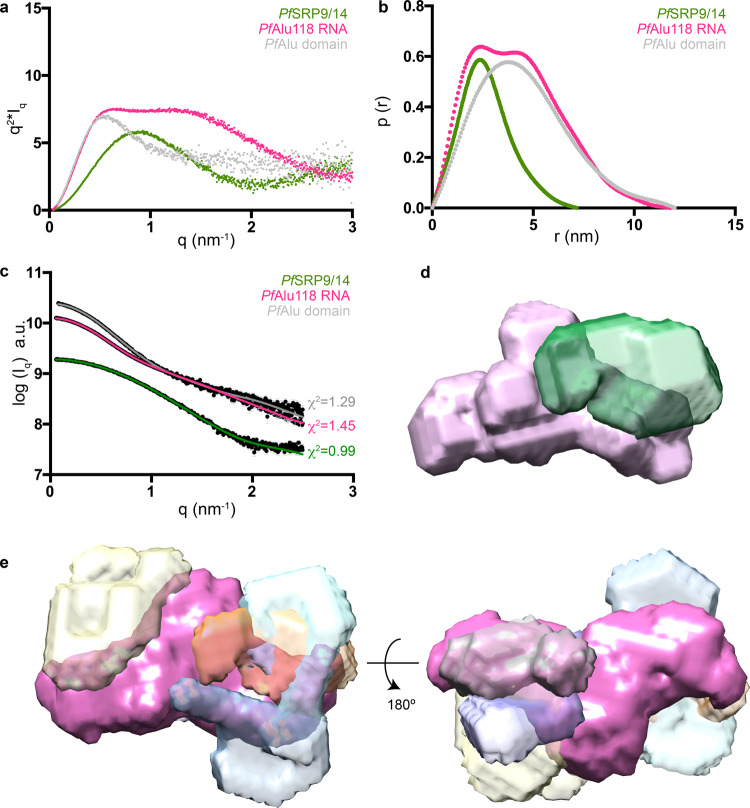
Fig. 6. SAXS analysis of the PfAlu domain.
a Kratky plots and b p(r) curves of the PfSRP9/14 heterodimer (green), PfAlu118 RNA (magenta), and PfAlu domain (gray) are presented. Data for PfSRP9/14 heterodimer and PfAlu118 RNA have been replicated from Fig. 4a, b. c MONSA modeling of PfAlu domain. Out of 10 MONSA runs, the data for the top-scoring run are shown. d Multi-phase ab initio models corresponding to the best-scoring MONSA run in c are shown. The RNA phase is colored in pink and protein phase in green. e Aligned, averaged, and filtered ab initio models of the RNA phase from 10 independent MONSA runs are shown in magenta, whereas the different positions of the protein phase occupied on the RNA are shown in various light colors. The protein phases of individual runs do not show spatial convergence but are placed overall near the three-helix junction. a.u. represents arbitrary units.

