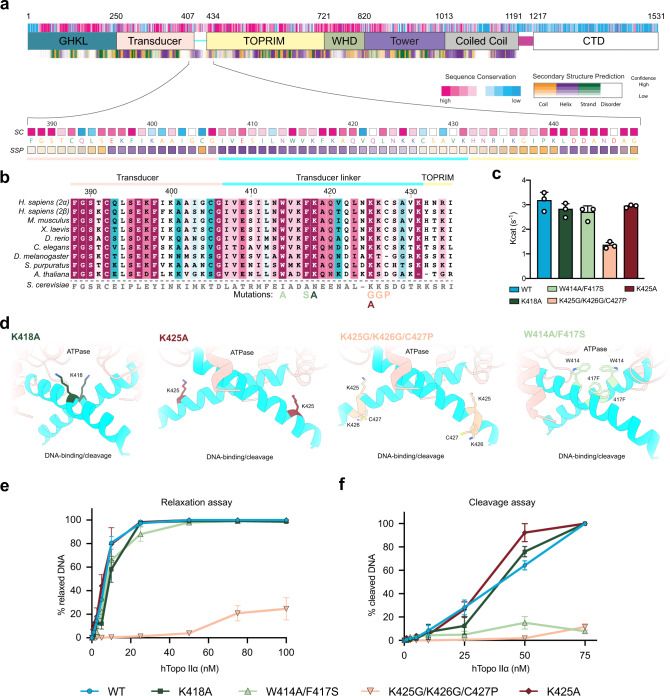
Fig. 4. Analysis of the hTopo IIα allosteric regulation mediated by the linker connecting the N-gate to the DNA-gate.
a Domain organization, sequence conservation, and secondary structure prediction for hTopo IIα. Below is a zoom view of the linker joining N-gate to DNA-gate showing the sequence at a residue level. SC stands for sequence conservation. SSP stands for secondary structure prediction. b Multiple sequence alignment focused on the linker region. The yeast sequence is displayed as information but was not included in the conservation calculation. c ATP hydrolysis activity of the wild-type, K418A, W414A-F417S and K425G-K426G-C427P and K425 hTopo IIα. Kcat values are presented as mean values ± standard error (SE) for three independent replicates (n = 3). Individual data points are also plotted. d Spatial localization of the mutated residues on the linker joining N-gate to DNA-gate. e Relaxation and cleavage f activities for the wild-type, K418A, W414A-F417S, K425G-K426G-C427P and K425A hTopo IIα. Zoomed panels on the region 0–10 nM is available in Supplementary Fig. 9. Data are presented as mean values ± SE for three independent replicates (n = 3). The source data for panels c, e, and f are provided as a Source Data file.

