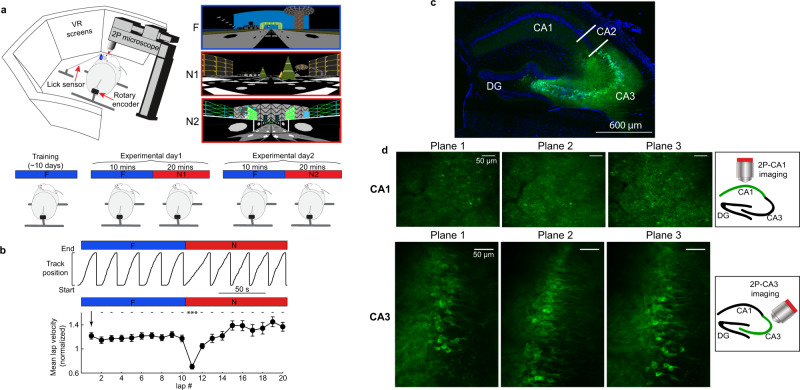
Fig. 1. Experimental setup.
a Top left, depiction of the virtual reality (VR) setup. Top right, the familiar (F) and two novel (N1 and N2) environments. Bottom: scheme of the experimental procedure. b Top: single mouse behavior showing track position versus time during an F to N switch. Bottom: summary data across all mice of mean lap velocity during F and N (n = 20 sessions in 11 mice). Lap velocity is normalized to the mean lap velocity in each mouse ±SEM, and each lap is compared to the first lap in F using a one-way ANOVA with Tukey HSD post hoc test. ***P < 0.001, P = 6.3 × 10⁻¹⁵. c Brain slice showing specific CA3 expression of cre-dependent GCaMP6f (green) and DAPI for nuclei (blue) from a Grik4-cre transgenic mouse. d Example field of views (FOV) from multiplane imaging in CA1 (top) and CA3 (bottom). Right: scheme of the position for the objective during imaging.

