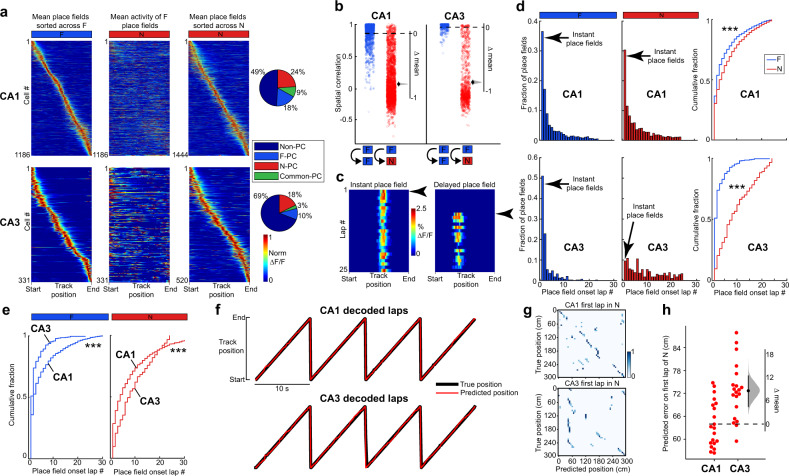
Fig. 2. Place field emergence in novel environments is rapid in CA1 but gradual in CA3.
a Left: mean place fields (PFs) in F sorted by track position. Middle: mean activity of the same neurons on the left in N. Right: mean place fields in N sorted by track position. Far right: percentage of place cells in F and N or common to both from all active neurons. CA1, top panels; CA3, bottom panels. ∆F/F activity is normalized to each neurons’ maximum transient amplitude. n = 7 sessions in four mice for CA1, n = 13 sessions in seven mice for CA3. Only place cells with single PFs are displayed, but place cells with multiple PFs are included in the pie charts and later analyses. b Pearson’s correlation coefficient of each cell’s average activity map within F (blue, CA1 n = 1392, CA3 n = 320 neurons with activity in both halves of the F session) and between F and N (red, CA1 n = 2283, CA3 n = 698 neurons with activity in both sessions and a PF in one of them). Bootstrapped mean difference (∆) with the distribution of the mean (gray) and 95% confidence interval (error bar) on the right of each plot (see Methods). c Example of an instant PF (left) and delayed PF (right) in N. Arrows indicate PF onset lap. d Histograms of PF onset laps in F (left, CA1 n = 1643 PFs, CA3 n = 336 PFs) and N (middle, CA1 n = 1712 PFs, CA3 n = 532 PFs) and cumulative fraction plots for F and N (right). Wilcoxon rank-sum test, two-sided. ***P < 0.001, CA1, P = 3.9 × 10⁻¹⁸, CA3, P = 1.6 × 10−55. e Cumulative fraction plots for CA1 and CA3 PF onset lap in F (left) and in N (right). Wilcoxon rank-sum test, two-sided. ***P < 0.001, F, P = 2.9 × 10⁻¹³, N, P = 7.4 × 10⁻¹³. f Example mouse showing true track position (black) on laps 37–40 and the predicted position (red) decoded by an LSTM decoder (see Methods). CA1, top; CA3, bottom. g Confusion matrix between the predicted (x axis) and the true (y axis) position for the first lap in N. h Predicted error on the first lap in N for CA1 and CA3. Each dot represents the decoding error for one decoder trial built based on the activity of 200 randomly chosen place cells from CA1 (left) or CA3 (right). n = 20 decoder trials. Bootstrapped mean difference (∆) with 95% CI (error bar) on the right.

