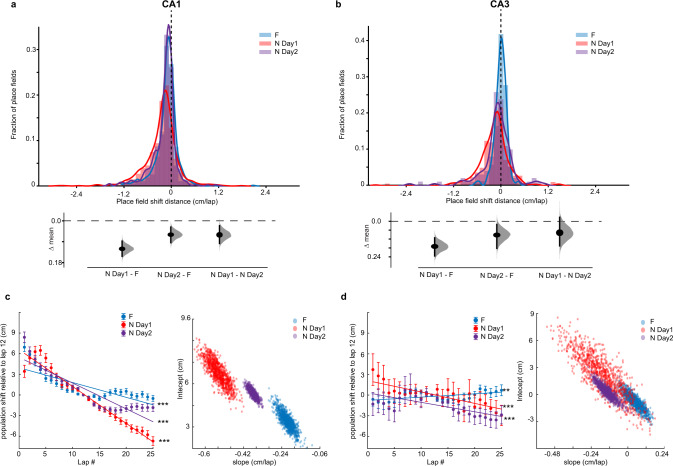
Fig. 6. Population backward shifting slows down with familiarization across days.
a Top, histograms of COMlast_lap–COMonset_lap (session shift defined as in Fig. 3d) in Familiar (F), N day 1 and N day 2, for CA1. Bottom, bootstrapped mean differences (∆) between the three conditions. b Same as a for CA3. c Population shift of PF COM. Left, mean ±SEM, over all PFs, of five-lap sliding average COM difference relative to lap 12 (see Methods), comparing CA1 population shifts in F (blue), N day 1 (red), and N day 2 (purple). Linear regression, F test, ***P < 0.001, F, P = 3.1 × 10−86, N Day 1, P < 1 × 10−100, N Day 2, P < 1 × 10−100. The resampling analysis uses a number of PFs equal to 80% of the number of PFs in the condition with the lowest number of PFs (1000 resamples). The lack of distribution overlap between conditions indicates dynamics are significantly different. d Same as c for CA3. Overlap in the slope distributions suggests that population dynamics are similarly flat (slopes close to 0) although CA3 PFs shifting become more homogeneous (smaller variance) with familiarization. Linear regression, F test, ***P < 0.001, F, P = 0.005, N Day 1, P = 1.3 × 10⁻⁴, N Day 2, P = 1.1 × 10⁻⁴.

