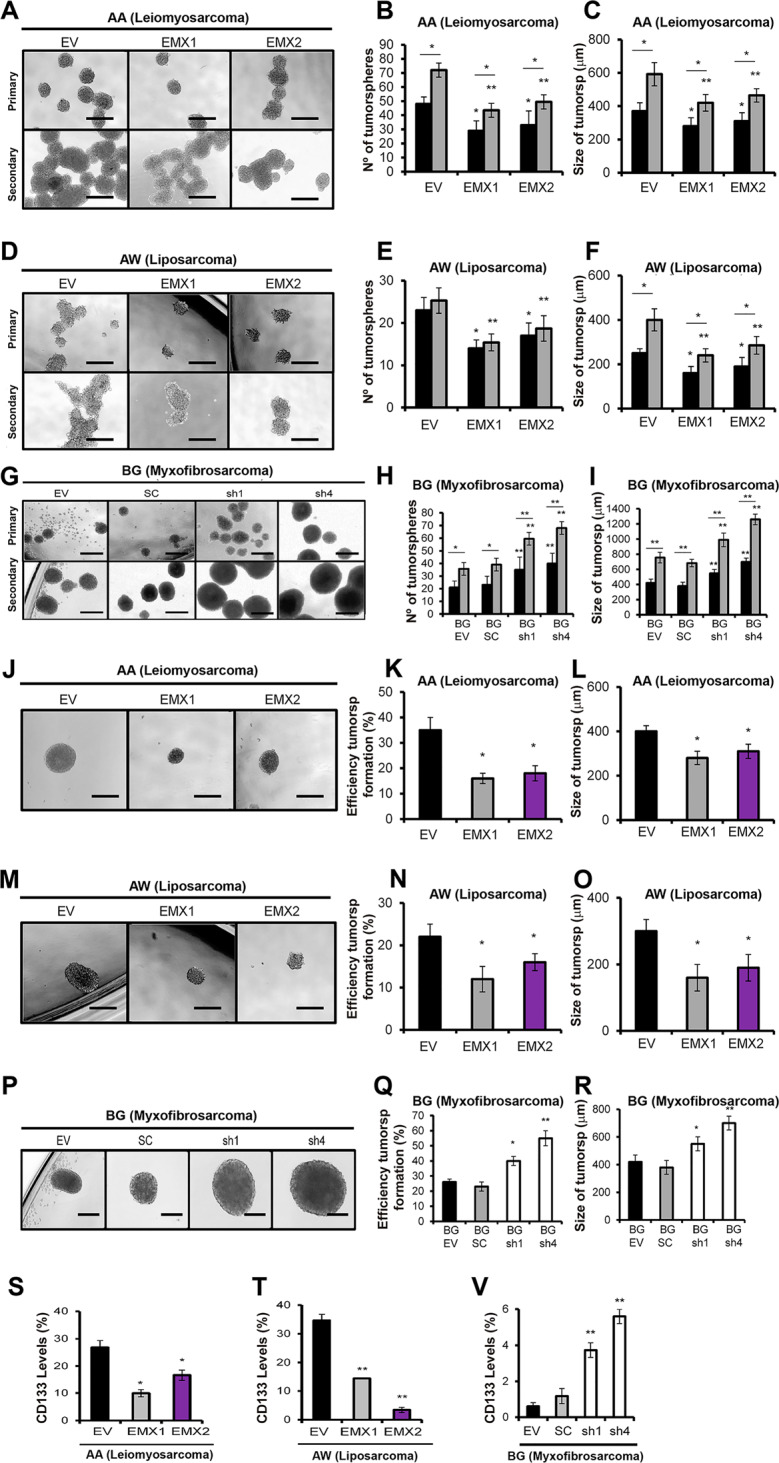
Fig. 3. Effect of different levels of EMX1 and EMX2 on tumorigenesis in sarcoma cell lines.

A, D Micrographs of the results of the primary and secondary tumor formation assays in the AA (A) and AW (D) sarcoma lines with EMX1 or EMX2 overexpression or in the BG cell line with EMXs downregulated by shRNAs (G). B, E, H Average number of primary (black bars) and secondary (gray bars) tumorspheres in AA (B), AW (E), and BG (H). In C, F, I, the mean sizes of the primary (bars in black) and secondary (bars in gray) tumors of AA (C), AW (F), and BG (I) are shown. J, M, P Representative images of tumor formation from isolated cells in the AA (J), AW (M), and BG (P) cell lines with different levels of EMX proteins. Sphere-formation efficiency of single cells for AA (K), AW (N), or BG (Q). Size of tumorspheres formed from an isolated cell in AA (L), AW (O), or BG with different levels of EMX proteins. All bars correspond to 500 µm. The mean of three independent experiments is represented in triplicate ± SD. Statistical analysis was performed with Student’s t-test (*p < 0.05; **p < 0.01; ***p < 0.001). S, T, V Effect of EMX1 and EMX2 levels on the percentage of CD133+ cells in sarcoma cell lines with different levels of EMX proteins. Graphs of the percentage of expression of the CD133 marker (conjugated with PE: CD133-PE), measured by FACS in the different models of lines AA (S) and AW (T) or BG (V) with different levels of EMX proteins.
