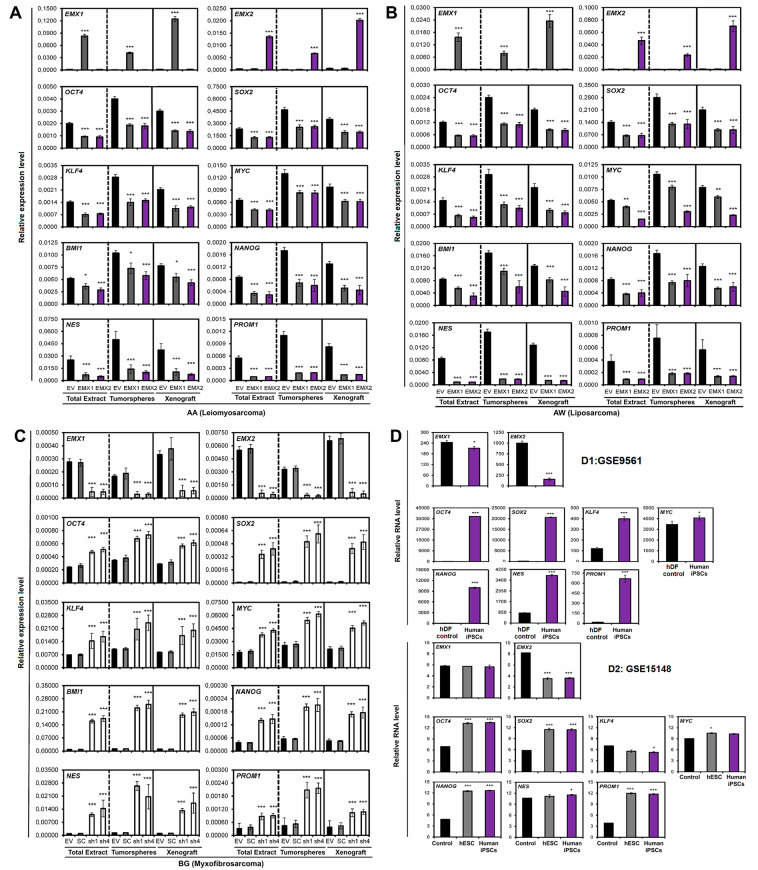
Fig. 4. Effect of EMX1 and EMX2 levels on the expression of genes related to the phenotype of stem cells.
Quantification of the relative mRNA levels of the EMX1, EMX2, OCT4, SOX2, KLF4, MYC, BMI1, NANOG, NES, and PROM1 genes by qRT-PCR in the different cell lines with different levels of EMX proteins. The graphs show the expression levels (2−ΔCt) of the different indicated genes for the total extract of the cell lines (ET), the tumorspheres (TO), and the xenograft tumors (XEN). A Line AA, B line AW, and C line BG. The average of a minimum of three independent experiments is represented in triplicate ± SD. Statistical analysis was performed with Student’s t-test (*p < 0.05; **p < 0.01; ***p < 0.001). D Transcriptional analysis of the genes EMX1 and EMX2, and those related to the properties of stem cells in public databases. D1 Analysis of the Yamanaka database (GSE9561), where the relative RNA levels of EMX1 and EMX2, and the genes related to the properties of stem cells (OCT4, SOX2, KLF4, and MYC) were measured. The database showed the transcriptome of induced pluripotent stem cells (iPSCs) generated from human dermal fibroblasts (hFDs). D2 Analysis of the Thomson database (GSE15148), where the relative RNA levels of EMX1 and EMX2, and stem cell genes were measured in human iPSCs generated from fibroblasts of the foreskin, used as a control and in human embryonic stem cells (hESCs). Statistical analysis was performed with Student’s t-test (*p < 0.05; **p < 0.01; ***p < 0.001).

