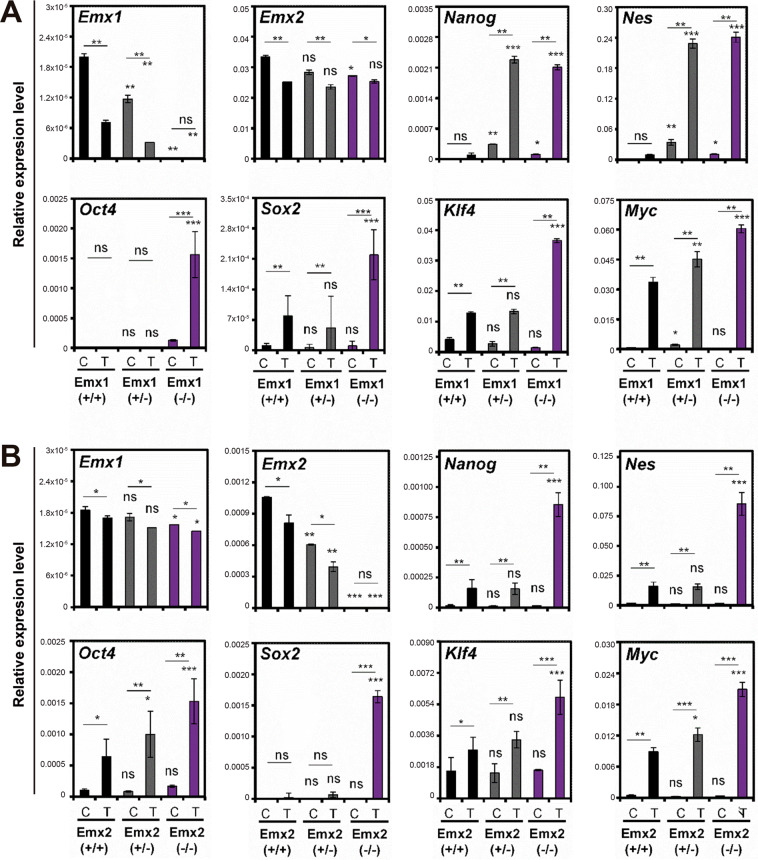
Fig. 7. Analysis of the expression levels of the regulatory genes of stem cell biology in 3MC-induced sarcomas of the Emx1 and Emx2 KO mice.
A, B Results of the relative expression (2−ΔCt) of Emx1, Emx2, Nanog, Nes, Oct4, Sox2, Klf4, and Myc in the different murine cohorts of Emx1 (A) and Emx2 (B) KO mice. The control muscle tissue is C and 3MC-induced sarcoma tumor tissue (T). The mean of a minimum of three independent experiments is represented in triplicate ± SD. Statistical analysis was performed with Student’s t-test (*p < 0.05; **p < 0.01; ***p < 0.001).

