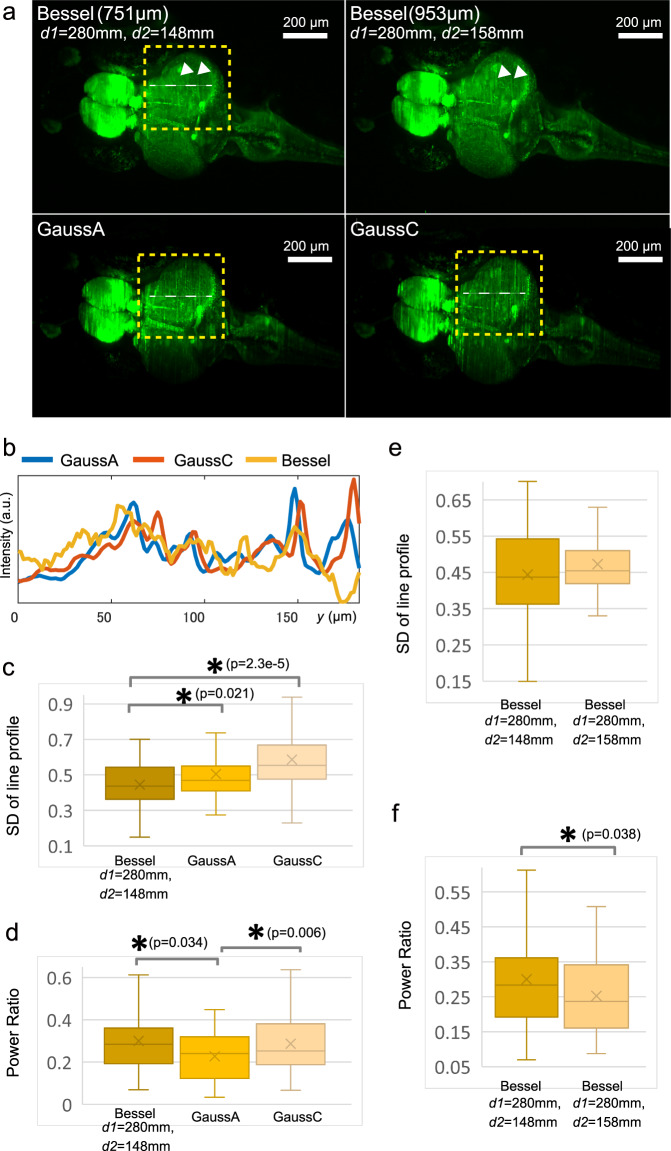
Fig. 4. Application of the tunable Bessel beam DSLM.
a Comparison of the brain image between the Gaussian and Bessel beams. Larvae of the Kif5Aa-EGFP strain, which expresses EGFP in neuronal cells35, are used. Images shown are acquired using the same larva. Yellow rectangles indicate the area where significant differences appear in the comparison of Gaussian and Bessel beam irradiations. White arrow heads indicate the area where significant differences appear in the comparison of different Bessel beam irradiations. Scale bar, 200 μm. n = 5 biologically independent larvae are subjected to the analysis. b Line profiles along the white lines in (a). a.u. arbitrary unit. c Standard deviations of the line profiles. d Ratio of the power spectra of the object smaller than 20 μm to that of the total. e Standard deviations of the line profiles for the Bessel beam ( = 280 mm and mm) and ( = 280 mm and mm). f Power ratio for the Bessel beam ( = 280 mm and mm) and ( = 280 mm and mm). c–f In the box plots, the lines of the box indicate the first quantile, median, and third quantile. Upper and lower whiskers indicate the minimum and maximum, respectively. The Cross mark represents the average. The asterisk indicates a p value <0.05 with one-sided t-test. Degrees of freedom for the t-test is 29. c–f For the analysis, six independent line profiles are extracted from n = 5 biologically independent larvae. In total, 30-line profiles are subjected to the analyses.

