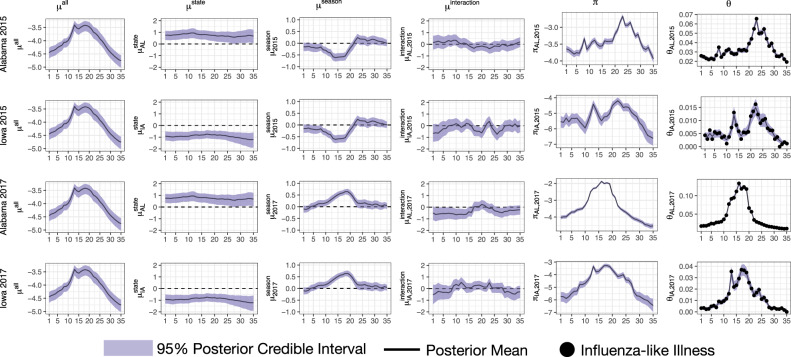
Fig. 9. Posterior summaries of Dante’s process model.
Posterior summaries for select components, seasons, and states of Dante, fit to seasons 2010 through 2017. Rows, from top to bottom, correspond to Alabama in 2015, Iowa in 2015, Alabama in 2017, and Iowa in 2017. Columns, from left to right, correspond to μall, μstate, μseason, μinteraction, π (all from Equation (5)), and θ (Equation (4)). The π column is the sum of the μall, μstate, μseason, and μinteraction columns, accounting for posterior covariances. The θ column is the inverse logit of the π column and is back on the scale of the data. The μall component is the most structured component, as it is common for all states and seasons (i.e., the same for all rows). The components μstate and μseason are the next most structured components. They describe the state-specific and season-specific deviations from μall, respectively, and are common for all seasons within a state (μstate) and all states within a season (μseason). The component μinteraction is the least structured component of Dante, as it is specific to each season/state (i.e., it is different for each row). Solid lines are posterior means. Ribbons are 95% posterior intervals. In the θ column, points are data, y.

