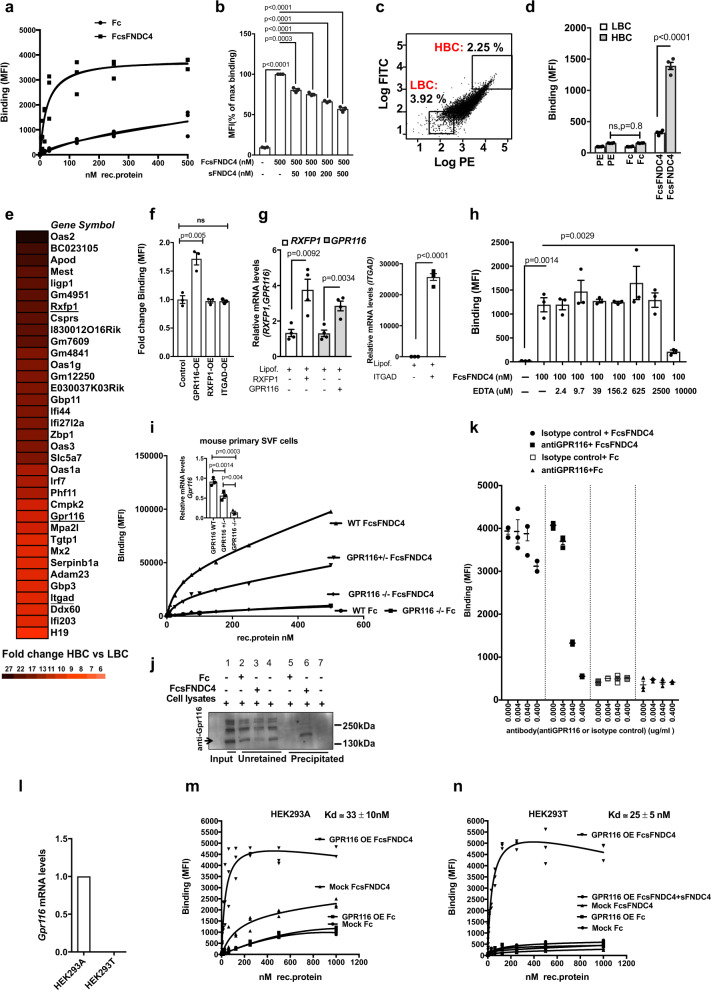
Fig. 4. Identification of GPR116 as a candidate receptor for sFNDC4.
a Saturation binding curves of FcsFNDC4 and Fc control to immortalized SVF (imm.SVF) preadipocytes derived from mouse iWAT. Y-axis shows ligand binding as mean fluorescence intensity (MFI) per 10,000 cells. Three replicate wells are shown per concentration of rec. protein. This experiment was repeated at least three times. b Competition of FcsFNDC4 binding (500 nM) with increasing concentrations of untagged sFNDC4. Data are expressed as percentage of max binding of 500 nM FcsFNDC4 (n = 3 independent experiments). Bars represent mean of three independent experiments ±SEM. c Gating of sorted cell populations of imm. SVF iWAT to very high log.PE/log.FITC signal (top 2.25% from total cell population = HBC-high binding cells) versus very low log.PE/log.FITC signal (bottom 3.92% from total cell population = LBC-low binding cells), positive for FcsFNDC4 binding (100 nM). This sorting was performed 20 times. d Binding of FcsFNDC4 (20 nM) and Fc control (20 nM) or only IgG-PE (PE) secondary in cells sorted from c after resorting and reseeding for 20 passages. Bars correspond to binding shown as MIF per 10,000 cells. This experiment was performed several times (20 times) up to passage 20 (n = 4 replicate wells). e Fold change mRNA expression data presented as a heat map. Top 35 genes identified with fold change HBC versus LBC >1.5 and p < 0.05 from Affymetrix gene expression arrays comparing LBC and HBC. Receptor genes are underlined. Color scale of fold change values is shown below the heat map. The means of three replicate wells per group (LBC and HBC) are compared. Absolute values and fold change calculations are presented in the Source data. The Affymetrix microarray data have been submitted to GEO (gene expression omnibus) under the identification GSE165329. Affymetrix arrays were performed once. f Fold change of binding (MFI) per 10,000 cells of FcsFNDC4 (100 nM) to HEK293A cells with transient overexpression of human RXFP1 or human GPR116 or human ITGAD. Binding to a mock transfection control (lipofectamine only) was used as control. n = 3 replicate wells of a representative experiment out of two independent experiments is shown. g (left and right panel) RT-qPCR quantification of the indicated genes at the indicated conditions. n = 4 replicate wells per condition are shown. This analysis was performed only once. TBP is used as a housekeeping gene. 2^ddCt values are shown. h Competition of FcsFNDC4 (100 nM) binding with increasing concentrations of EDTA (0–103 µM). Values are binding shown as MFI per 10,000 cells. n = 3 replicate wells of a representative experiment out of two independent experiments is shown. Cells are primary mouse SVF preadipocytes (iWAT). i Binding (MFI) of the indicated concentrations of FcsFNDC4 or Fc control to mouse SVF preadipocytes (iWAT) from WT, GPR116+/−, and GPR116−/− mice. n = 1 replicate well of cells pooled from n = 7–8 mice per genotype per tested concentration of rec. protein. This experiment was performed once. Mice were male, 7–9 weeks old. (i—top panel) RT-qPCR quantification of mRNA levels of Gpr116 in SVF iWAT preadipocytes used for binding in i at the indicated genotypes (n = 3 independent mice per genotype). Tbp is used as a housekeeping gene. j Pull down for GPR116: western blot analysis against GPR116. For pull down, 6xHis Dynabeads were prebound with 6xHis-Fc and 6xHis-Fc-sFNDC4 (30 µg), followed by incubation of 300 µg NIH3T3 cell lysates. (+) added to beads, (−) not added to beads, Input: rec. protein or cell lysates added to the Dynabeads. Unretained: cell lysates proteins that did not immunoprecipitate to the beads. Eluted: elution of GPR116, which precipitated on 6xHis-Fc-fused protein prebound to beads. Similar results were obtained from three independent experiments. Antibody against GPR116: ab136262. Representative WB out of three independent experiments is shown. Uncropped blot image is shown in Source data. k Mean fluorescence intensity (MFI) representing binding of FcsFNDC4 (100 nM) or Fc control (100 nM) to HEK293T GPR116 (human) OE cells in the presence of the indicated dose of antiGPR116 antibody, against the N-terminus of GPR116 (ab111169) or isotype control (ab171870). This experiment was performed once with n = 3 technical replicates. l q-PCR quantification of human Gpr116 mRNA levels in HEK293A (Ct = 25) and HEK293T (Ct = undetected) cells, n = 3 replicate wells per group. This quantification was performed once. m, n Saturation binding on HEK293A (m) or HEK293T (n) cells with stable human GPR116 OE or mock cells after incubation with the indicated concentrations of FcsFNDC4 or Fc control. For n, FcsFNDC4 binding was also performed in excess of sFNDC4 (1 mM) to determine non-specific binding (NSB). Calculated equilibrium binding constant (Kd) is shown for total binding in m and specific binding in n. In m, n, n = 3 replicate wells are shown of a representative experiments out of three independent experiments. In b, d, f–i (top panel), k, data are shown as mean ± SEM. Statistical analysis in b, d, f–i (top panel) represents unpaired two-tailed t test. For a, b, f, h, i, k, m, n, a representative gating is shown in Supplementary Fig. 1a. All cells were gated and thus MFI values were derived always from all assessed cells. Source data are provided as a Source data file.

