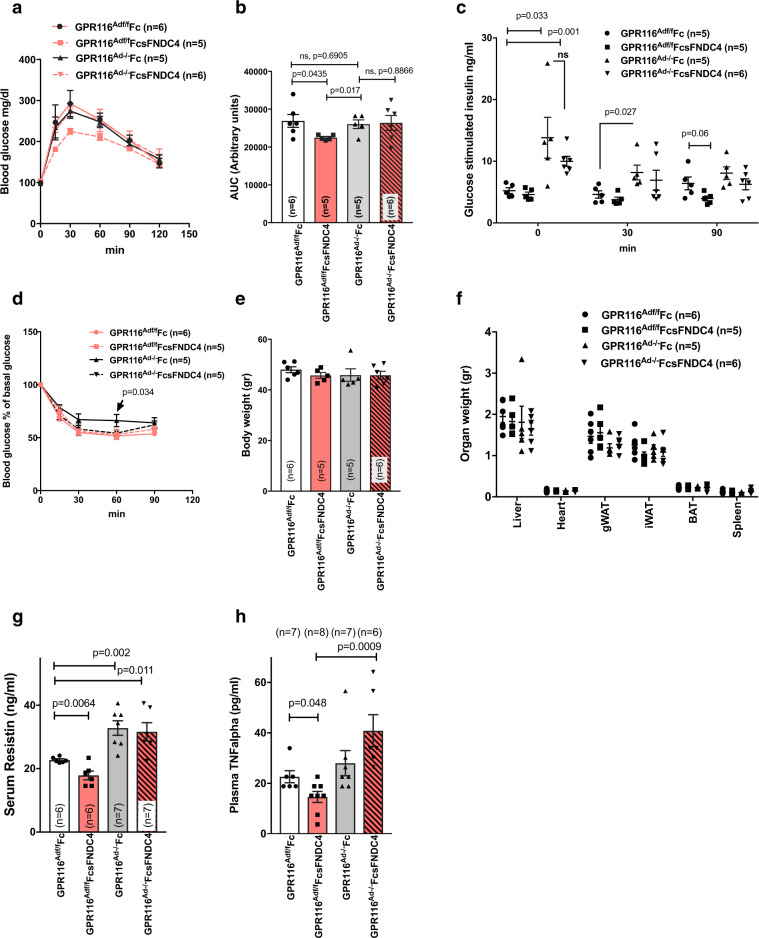
Fig. 5. HFD fed GPR116Ad−/− mice did not improve glucose tolerance in response to FcsFNDC4 therapeutic injections as opposed to GPR116Adf/f mice.
a Blood glucose during IPGTT test at the indicated time points and area under the curve (b). c Glucose-stimulated insulin response during the IPGTT in a, b. d Blood glucose as percentage of baseline glucose levels during an ITT. e Body weight, f organ weight, g serum resistin, and h plasma TNFalpha at the indicated groups. White bars: GPR116Adf/f Fc-injected mice, red bars: GPR116Adf/f FcsFNDC4-injected mice, grey bars GPR116Ad−/− Fc-injected mice, red bars/pattern: GPR116Ad−/− FcsFNDC4-injected. Mice were males, set on a HFD 60% fat when 9–10 weeks old, for 12 weeks. FcsFNDC4 injections were given at a dose of 0.2 mg/kg every second day for 4 weeks (injections between weeks 8 and 12 of HFD), n = 6–8 mice per group. Exact number of mice are shown on figures and also described in the Source data. During IPGTT and glucose-induced insulin test, 2 g/kg d-glucose was injected and during the ITT 0.8 U/kg insulin was used ip. In all panels, data are presented as mean ± SEM. Statistics represent unpaired two-tailed t test. p p-value, ns non-significant. Source data are provided as a Source data file.

