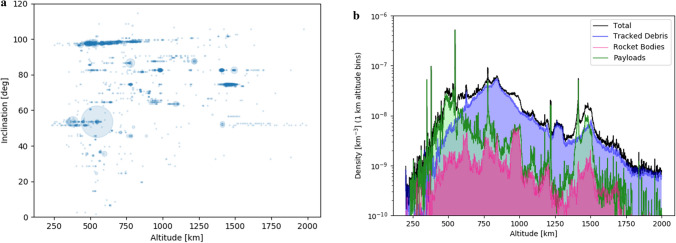
Figure 2.
Orbital distribution and density information for objects in Low Earth Orbit (LEO). (Left) Distribution of payloads (active and defunct satellites), binned to the nearest 1 km in altitude and 1° in orbital inclination. The centre of each circle represents the position on the diagram, and the size of the circle is proportional to the number of satellites within the given parameter space. (Right) Number density of different space resident objects (SROs) based on 1 km radial bins, averaged over the entire sky. Because SRO objects are on elliptical orbits, the contribution of a given object to an orbital shell is weighted by the time that object spends in the shell. Despite significant parameter space, satellites are clustered in their orbits due to mission requirements. The emerging Starlink cluster at 550 km and 55° inclination is already evident in both plots (Left and Right).

