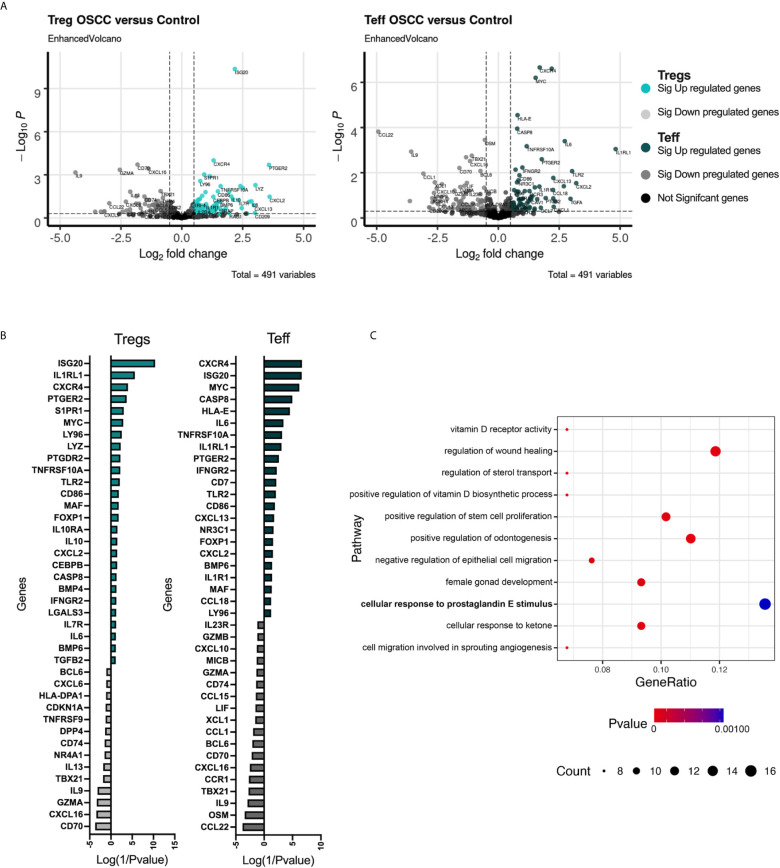
Figure 5.
Transcriptomic analysis of Tregs and Teff after co-culture with control or OSCC secretome revealed pathways associated with the VitD and PGE2 signaling. (A) Volcano plots showing RNA-seq data obtained from 3 paired Tregs and Teff after co-culture with control or OSCC secretome. Vertical dotted lines indicate 1.5-fold change threshold and horizontal dotted line indicate P value 0.05. Colored dots show significant up regulated genes, whereas grey dots show significant down regulated genes in Th subsets when comparing cells co-cultured with OSCC secretome versus control secretomes. (B) Heatmap showing upregulated (colored with positive values) and downregulated (grey with negative values) genes in Tregs and Teff after co-culture with control or OSCC secretome. Log(1/Pvalue) was used to normalize the p values obtained when comparing each gene between control and OSCC secretome in Treg or Teff. (C) A pathway enrichment analysis was performed using the Gene Ontology Consortium database (data-version Released 2021-02-01) including biological processes. Cytoscape v.3.8.2 with the ClueGO plugin v.2.5.7 was used with a (p<0.01) and a kappa statistics score = 0.4 to calculate the relationships between the terms based on the similarity of their associated genes. Circles represent gene counts found in each pathway and p value is the probability of seeing at least x number of genes out of the total n genes in the list annotated to a particular GO term.

