Figure 6.
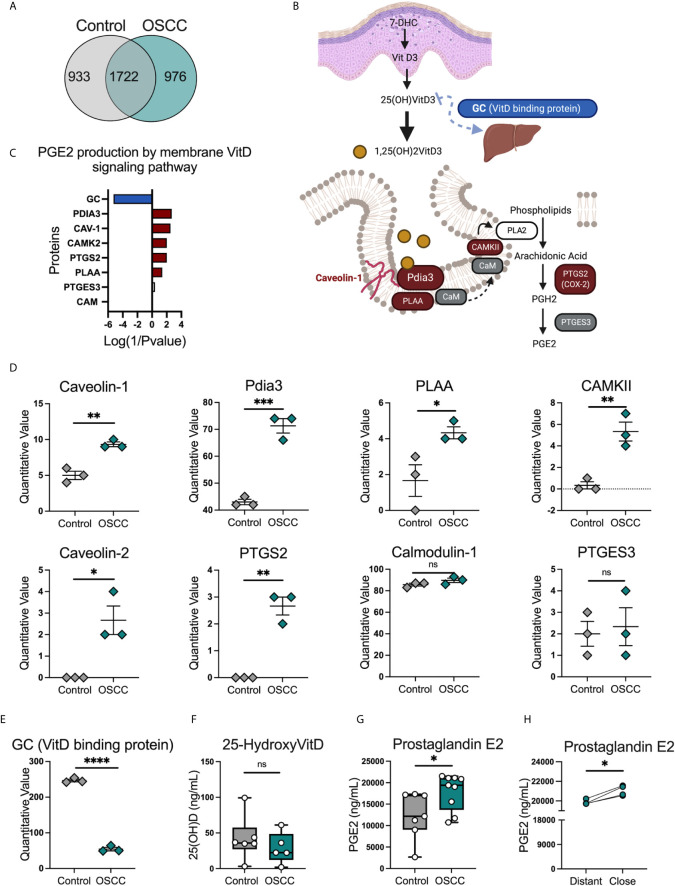
Proteomic analysis identified several proteins related with the PGE2 production by membrane vitamin D signaling pathway in OSCC secretomes. (A) Venn diagram of unique and common proteins identified in secretome obtained from biopsies from 5 OSCC and 5 control samples using timsTOF Pro.(B) Proteins and (C) diagram of the PGE2 production by membrane vitamin D signaling pathway. Briefly, overexpressed proteins in OSCC were colored in red, reduced proteins in OSCC were colored in blue and proteins present in the secretomes but with no statistical difference between control and OSCC were colored in grey. (D) Quantitative values of proteins from the PGE2 production by membrane vitamin D signaling pathway, data are presented as mean ± SEM using scatter dot plots (Unpaired t test). (E) Quantitative values of vitamin D binding protein or GC, data are presented as mean ± SEM using scatter dot plots (Unpaired t test). (F) Levels of 25(OH)VitD and (G) PGE2 were compared between cancer and control secretomes, data are presented as mean ± SEM using bars with scatter dot plots (Unpaired t test). (H) Levels of PGE2 were measured in secretomes from distant and close OSCC biopsies to the tumor site, data is presented with individual symbols with paired lines (Paired t test). For all statistical tests, ∗∗∗∗p < 0.0001, ∗∗∗p < 0.001, ∗∗p < 0.01 and ∗p < 0.05 were considered significant. ns, not significant.

