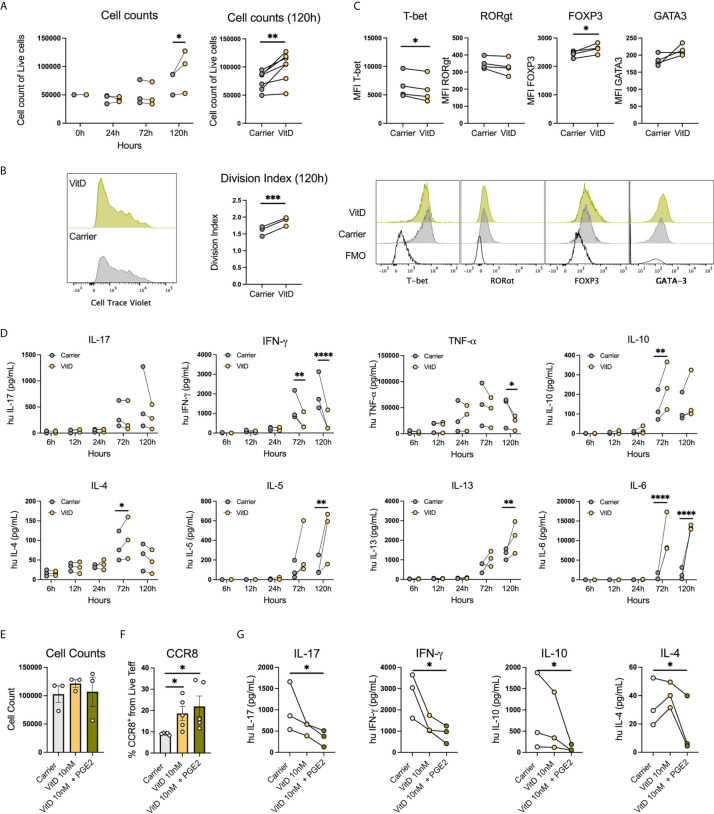
Figure 7.
PGE2 with VitD induce CCR8 expression and inhibit cytokine production in Th cells. (A) Representative histograms and cumulative data of cell counts and (B) division index of sorted memory Teffs (2×10⁵) activated with anti-CD3/CD28 beads (1:5) in the presence or absence of 1,25(OH)VitD3 (10nM in ethanol) or Carrier (ethanol) at 24h, 72h and 120h post activation. Data are presented as individual symbols with paired lines (Two-way Repeated Measure ANOVA and Paired t test). (C) Representative histograms and cumulative data of transcription factor expression of sorted memory Teffs (2×10⁵) activated with anti-CD3/CD28 beads (1:5) in the presence or absence of VitD (10nM in ethanol) or Carrier (ethanol) at 120h post activation. Data are presented as individual symbols with paired lines (Paired t test). (D) Cytokines were measured in supernatants obtained from sorted memory Teffs (2×10⁵) activated with anti-CD3/CD28 beads (1:5) in the presence or absence of 1,25(OH)VitD3 (10nM in ethanol) or Carrier (ethanol) at 6h, 12h, 24h, 72h and 120h post activation. Data are presented as individual symbols with paired lines (Two-way Repeated Measure ANOVA). (E) Cell counts, (F) CCR8 expression and (G) cytokine production were measured in anti-CD3/CD28 pre-activated Teff cells (1x10⁵) cocultured with carrier (ethanol), 1,25(OH)VitD3 (10nM in ethanol) or 1,25(OH)VitD3 (10nM in ethanol) in combination with PGE2 (5uM) for 72h with flow cytometry. Data is presented as mean ± SEM using column bars plots with bars with scatter dot plots for phenotype and individual symbols with paired lines values for cytokine production (Paired t test). For all statistical tests, ∗∗∗∗p < 0.0001, ∗∗∗p < 0.001, ∗∗p < 0.01 and ∗p < 0.05 were considered significant.

